Statistical Data on Drugs in North Dakota
North Dakota presents a complex picture of substance use and addiction that differs significantly from national patterns. The state demonstrates lower rates of drug use across most categories compared to the national average, yet faces persistent challenges with specific substances and demographic groups. Notably, while overall drug use remains below national levels, the state has experienced a dramatic 73.68% increase in overdose deaths over a three-year period, with fentanyl emerging as an increasingly deadly presence. The data (partly gathered via href=”https://www.methadone.org/get-clean/hair-drug-test/”>hair drug tests) reveals particular vulnerabilities among young adults, Native American populations, and rural communities, while also highlighting the state’s evolving treatment infrastructure and prevention efforts.
Overdose Death Statistics
Overall Overdose Deaths
- 148 drug overdose deaths per year
- 2.17% of all deaths are from drug overdose
- OD deaths increased by 73.68% over the last 3 years
- The OD death rate is 19.8 deaths per 100,000 residents
- 37.97% less than the national OD death rate
- 0.14% of nationwide OD deaths occur in North Dakota

North Dakota has experienced a concerning 73.68% increase in overdose deaths over three years. This dramatic rise suggests an evolving drug crisis that demands immediate attention, even as the state maintains rates below the national benchmark.
Historical Trends
- 2014: 43 overdose deaths
- 2016: 77 overdose deaths
- 2018: 70 overdose deaths
- 2022: 135 overdose deaths (peak)
- 2023: 113 deaths (16% decrease from 2022)
- 2024 (Jan-July): 54 deaths projected
The data shows volatility in overdose deaths with a peak in 2022 followed by improvement in 2023.
Overdose Death Rate by Time Period
- 2019: 0.98 per 10,000
- 2022: 1.44 per 10,000
- 2023: 1.44 per 10,000
- 48% increase from 2019 to 2023
- Average: 2 North Dakotans die each week from unintentional drug overdose
The steady increase in the overdose death rate over five years demonstrates the persistent nature of the crisis despite treatment expansion and prevention efforts.
Drug-Induced Deaths Comparison (2007-2009)
- 2007: 37 drug-induced deaths
- 2009: 28 drug-induced deaths
- Drug-induced deaths were 4.3 per 100,000 (less than half the national rate of 12.8)
- Compared to 115 motor vehicle deaths and 57 firearm deaths in same period

The dramatic increase from 28 deaths in 2009 to 148 current annual deaths represents more than a fivefold increase, demonstrating how rapidly the crisis has escalated.
Opioid-Specific Statistics
Opioid Overdose Deaths
- 87 opioid overdose deaths in 2023
- Opioids factor in 71.3% of all overdose deaths
- 11.7 deaths per 100,000 residents
- 51.3% less than the national opioid death rate
- Synthetic opioids (fentanyl) involved in 87.4% of all opioid overdose deaths
The overwhelming involvement of synthetic opioids in fatal overdoses reflects the national trend toward increasingly dangerous street drug supplies.
Fentanyl Deaths
- 2019: 42% of deaths tested positive for fentanyl
- 2023: 77% of deaths tested positive for fentanyl
- 403 fentanyl-involved deaths from 2019-2024
- Since 2019: 64% of overdose deaths had fentanyl present
- Fentanyl death rate peaked at 1.26 per 10,000 in 2022
Fentanyl’s potency and unpredictable presence in the drug Supply creates extraordinary risk for users.
Emerging Threats
- 13 xylazine-positive overdose deaths reported since 2019
The appearance of xylazine, a non-opioid tranquilizer often combined with fentanyl, represents an evolving threat that complicates overdose response and treatment.
Opioid Prescribing
- Doctors write enough prescriptions for 32.4% of residents
- Controlled substance prescriptions increased from 935,201 in 2008 to 1,498,714 in 2015
- Decreased to 1,195,475 in 2019
- 2020: 21.4 of every 1,000 births diagnosed with neonatal Opioid Withdrawal syndrome

The reduction in prescriptions from the 2015 peak suggests prescribing reforms are taking effect, though the rate of neonatal Opioid Withdrawal syndrome indicates persistent maternal opioid use issues.
Substances Involved in Overdose Deaths (2019-2024)
| Substance | Number of Deaths | Percentage of Total Deaths |
| Total Overdose Deaths | 625 | 100% |
| Opioids | 490 | 78.4% |
| Fentanyl | 403 | 64.5% |
| Amphetamines | 347 | 55.5% |
| Alcohol | 190 | 30.4% |
| Marijuana | 186 | 29.8% |
| Benzodiazepines | 103 | 16.5% |
The prevalence of polysubstance involvement, with most deaths involving multiple substances, underscores the complexity of modern substance use patterns and the challenges in preventing fatal overdoses.
Polysubstance Use
- Majority of deaths involved more than one substance
- Most common two-substance combination: opioids and amphetamines (37%)
The dominance of opioid-amphetamine combinations reflects dangerous mixing patterns that may be intentional or result from contaminated drug supplies.
Demographic Characteristics of Overdose Deaths
Gender Distribution
- Two-thirds of overdose deaths were males
- 2019-2023: Male overdose death rate: 1.95 per 10,000
- 2019-2023: Female overdose death rate: 0.99 per 10,000
Males die from overdoses at nearly twice the rate of females, consistent with national patterns and likely reflecting higher rates of substance use and risk-taking behaviors among men.
Age Distribution
- Most overdose deaths under age 39
- Average age of overdose death: 37.2 years
The concentration of overdose deaths in younger age groups represents substantial lost years of life and reflects patterns of substance use initiation and progression in early adulthood.
Racial Disparities
- 2019-2023: American Indian overdose death rate: 8.48 per 10,000
- 2019-2023: White population overdose death rate: 1.14 per 10,000
- American Indian rate is over 7 times higher than White population rate
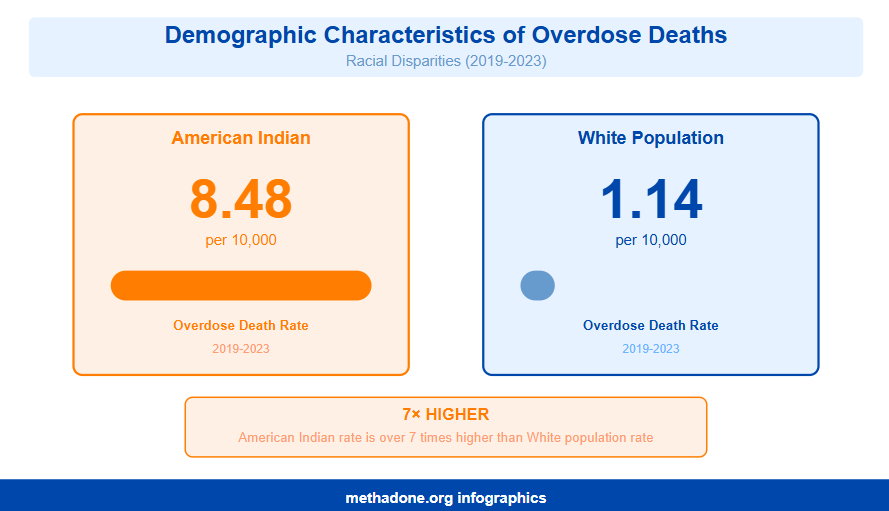
The dramatic disparity in overdose deaths among Native Americans represents a public health crisis.
Location of Deaths
- Over 74% of deaths occurred at a home or apartment
- 30% of overdose deaths had alcohol present in toxicology results
The predominance of deaths in residences suggests opportunities for peer intervention and highlights the importance of naloxone access in private settings.
Geographic Distribution
- 33 counties in North Dakota have recorded an overdose death since 2019
- Mountrail, Sioux, and Benson Counties have the highest rates (over 2x state average)
The concentration of deaths in specific counties suggests localized epidemics requiring targeted interventions, particularly in rural areas with limited treatment resources.
Current Substance Use Rates
Overall Illicit Drug Use (2021-2022 data, ages 12+)
- 12.07% past-month illicit drug use
- 17.70% past-year marijuana use
- 11.30% past-month marijuana use
- 3.30% illicit drug use other than marijuana (past month)
North Dakota’s illicit drug use rates remain below national averages, though more than one in ten residents reports recent drug use.
Youth Drug Use (Ages 12-17)
- 6.18% report using drugs in the last month (14.81% less likely than average American teen)
- 8.19% used alcohol in the last month (19.01% more likely than average American teen)
- Among youth who used illicit drugs, 75% reported marijuana use
- 7.78% used marijuana in the last year
- 0.16% used cocaine in the last year
- 0.08% used methamphetamine in the last year
- 1.91% used pain relievers (non-medical) in the last year
While North Dakota youth show lower illicit drug use than the national average, their higher alcohol use rates suggest substance abuse remains a concern requiring prevention efforts focused on all substances.
Young Adults (Ages 18-25)
- 20,000 used drugs in the last month
- 21.52% less likely to use drugs than average American in same age group
- 13.0% of young adults (age 18-29) report marijuana use in past 30 days
- 12.3% of college students used marijuana within past 30 days, some engaged in THC detox afterwards
Young adults show substantially lower drug use than national peers.
Adult Use (26+)
- 6.0% report marijuana use in past month (compared to 8.3% nationally)
- 3.6% report non-medical use of pain relievers in past year (equal to national rate)
- 3.1% report using illicit drugs other than marijuana in past month
Adult drug use rates remain modest compared to national figures.
Specific Substances (Ages 12+, 2021-2022)
- Cocaine use in past year: 1.45%
- Heroin use in past year: 0.42%
- Hallucinogen use in past year: 2.82%
- Methamphetamine use in past year: 1.18%
- Prescription pain reliever misuse in past year: 2.94%
- Opioid misuse in past year: 3.14%
Use rates for harder drugs remain low, though any opioid misuse carries significant overdose risk in the fentanyl era.
Substance Use Disorders
Overall Substance Use Disorder Rates (Ages 12+, 2021-2022)
- 19.68% have substance use disorder
- 8.51% have drug use disorder
- 1.70% have pain reliever use disorder
- 1.90% have opioid use disorder
Nearly one in five North Dakotans meets criteria for substance use disorder, representing a substantial population needing treatment services.
Youth Substance Use Disorders (Ages 12-17)
- 8.97% have substance use disorder
- 5.07% have drug use disorder
- 6.20% met criteria for drug use disorder in past year
- 2.54% met criteria for alcohol use disorder in past year
Nearly one in eleven youth has a substance use disorder, highlighting the importance of early intervention and youth-focused treatment services.
Young Adult Disorders (Ages 18-25)
- 31.02% have substance use disorder
- 15.75% have drug use disorder
Young adults show the highest rates of substance use disorder of any age group, reflecting the peak risk period for addiction development. Hair drug testing also suggests that they engage in continuous drug use.
School-Based Issues
- 12.1% of high school students were offered, sold, or given illegal drug on school property during the year
- 27.2% of high school students used marijuana in last 30 days (compared to 19.8% nationally)
- 5.0% tried marijuana before age 13.5 (equivalent to approximately 1,989 students)
Higher-than-national marijuana use among high school students and significant drug activity on school property highlight the need for school-based prevention and intervention programs.
Perceptions and Attitudes
Risk Perception
- 17.80% perceive great risk from smoking marijuana once a month
- 73.7% of youth (12-17) do NOT perceive great risk in smoking marijuana once a month
- 76.7% of adults (18+) do NOT perceive great risk in smoking marijuana once a month
- 77% of young adults thought smoking marijuana once or twice a week had no risk or slight risk
Low risk perception of marijuana use across all age groups may contribute to high usage rates and complicates prevention messaging.
Community Perspectives
- 85.3% of adults believe youth marijuana use is a problem in their community
- 76.2% of adults believe adult marijuana use is a problem
- 82.4% believe youth prescription drug use is a problem
- 85.9% believe adult prescription drug use is a problem
- 53% of young adults support legalizing possession of small amounts of marijuana
- 38.7% of adults believe it is not at all difficult to access marijuana
- 29.7% believe it is not difficult to access prescription drugs
- 68.9% believe it is difficult to access methamphetamine (increase from 62% in 2015)
The disconnect between viewing substance use as a community problem.
Treatment and Service Utilization
Treatment Facilities
- 90 active substance abuse clinics
- 65 total drug and alcohol rehabs (2006 data)
- 3 facilities offer free drug rehab treatment for all patients
- Increase from 47 rehabs in 2002 to 65 in 2006
The expansion of treatment facilities reflects growing recognition of need, though the limited number of free facilities may create access barriers for uninsured individuals.
Treatment Enrollment
- 3,754 clients serviced annually
- March 2019 single-day count: 3,754 enrolled (increase from 2,404 in 2015)
- 3,358 clients enroll in outpatient services annually
- 321 clients enroll in residential (non-hospital) services
- 75 clients in hospitals for drug rehab
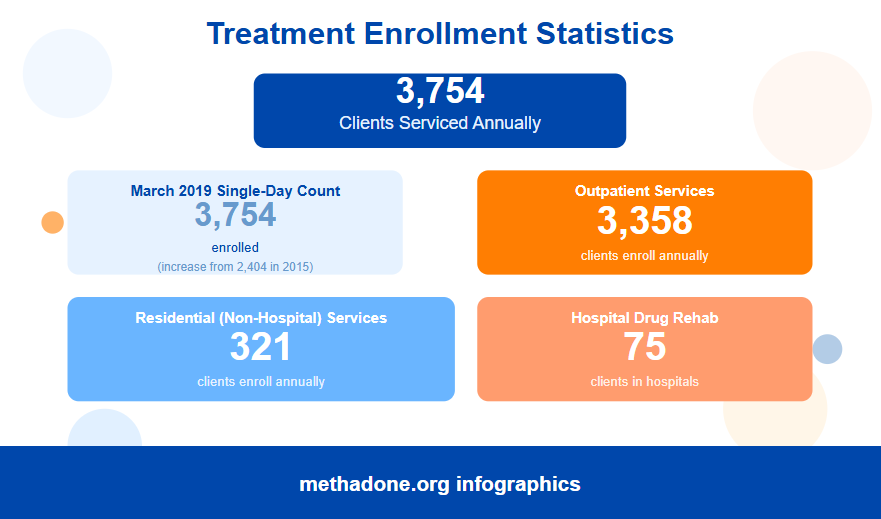
The 56% increase in enrolled clients from 2015 to 2019 demonstrates both growing need and improving treatment access.
Treatment Focus (March 2019 single-day count)
- 39.3% received treatment for drug problem only
- 15.9% received treatment for alcohol problem only
- 44.7% received treatment for both drug and alcohol problems
The prevalence of co-occurring drug and alcohol problems underscores the need for comprehensive treatment approaches addressing multiple substances.
Medication-Assisted Treatment
- March 2019: 535 people receiving methadone (increase from 0 in 2015)
- March 2019: 710 people receiving buprenorphine (increase from 84 in 2015)
The dramatic expansion of medication-assisted treatment represents a crucial advancement in evidence-based opioid addiction treatment.
Treatment Need and Gap
- 20.03% classified as needing substance use treatment (ages 12+)
- 76.74% of those needing treatment not receiving it
- 4.78% received substance use treatment in past year
The vast majority of people needing treatment do not receive it, representing a critical gap in the treatment system requiring attention to barriers including cost, stigma, and access.
Treatment Admissions by Primary Substance (2010-2011 data)
- Marijuana: 696 admissions (65.9% male, 33.6% female), largest age group 12-17
- Amphetamines: 145 admissions (44.1% male, 55.9% female), largest age group 21-25
- Two-thirds of 2011 treatment admissions were for marijuana
Marijuana dominates treatment admissions particularly among youth, while amphetamine treatment seekers skew female and slightly older.
Treatment Costs
Average Costs
- Outpatient treatment: $1,376 per individual
- Residential treatment: $64,673 per individual
- North Dakota ranks 45th in cost for residential treatment (45th cheapest)
- North Dakota is #1 cheapest state for outpatient treatment
North Dakota’s exceptionally affordable treatment costs may facilitate access though questions remain about treatment capacity and quality at these price points.
Public Spending
- $4.62 million (0.2% of U.S. total) spent on outpatient services
- $20.76 million (0.4% of U.S. total) spent on residential treatment

The state’s investment in treatment services appears proportionate to its population, though the treatment gap suggests additional resources may be needed.
Law Enforcement and Criminal Justice
Drug Seizures and Arrests
- 49% of drugs seized in 2019 were marijuana-related
- Nearly 15% of total arrests in 2019 were for drug/narcotic violations
Most Common Drug Seizures
- Marijuana: 3,651 cases
- Amphetamines/methamphetamines: 2,498 cases
- Heroin: 325 cases
- Other narcotics: 290 cases
Marijuana and methamphetamine dominate law enforcement encounters, reflecting both prevalence and enforcement priorities.
Correctional Population
- 94.6% of women entering correctional facilities have active substance use disorder diagnosis
- 84.7% of men entering correctional facilities have active substance use disorder diagnosis
The near-universal presence of substance use disorders among incarcerated individuals underscores the need for treatment services within the criminal justice system.
Harm Reduction Services
Syringe Service Programs
- 667 individuals received services (January-June 2020)
- 60% increase in participants compared to same period in 2019
- 192 referrals to substance use treatment centers resulted from programs (January-June 2020)

Growing utilization of syringe service programs demonstrates their value in reaching high-risk populations and connecting them to treatment services.
HIV/AIDS Related to Drug Use
- 1.3 new HIV/AIDS diagnoses connected to intravenous drug use in 2023
Low rates of injection-related HIV suggest harm reduction efforts may be effectively preventing disease transmission.
Statistical Data on Alcohol in North Dakota
North Dakota faces significant challenges with alcohol consumption, ranking among the highest in the nation for binge drinking and showing substantial increases in per capita consumption over the past two decades. The state’s drinking culture, supported by the highest number of bars per capita in the United States, contributes to widespread alcohol-related problems across all age groups. This report synthesizes available data on alcohol use, associated harms, and community attitudes toward prevention.
Alcohol-Related Deaths and Harms
Mortality
- 347 annual deaths attributable to excessive alcohol use
- North Dakota averages 1 death from excessive alcohol use for every 2,245 people aged 18 and older (5.85 deaths per 10,000 adults)
- 70.3% of those who die from excessive alcohol use are male
- 62.2% of deaths are from chronic causes, such as Alcohol Use Disorder
- 82.1% of deaths are adults aged 35 years and older
- 2.59% of deaths are under age 21
- The 5-year average annual rate increased by 58.2% from 2015 to 2019
- The CDC estimates 8,898 years of potential life lost annually
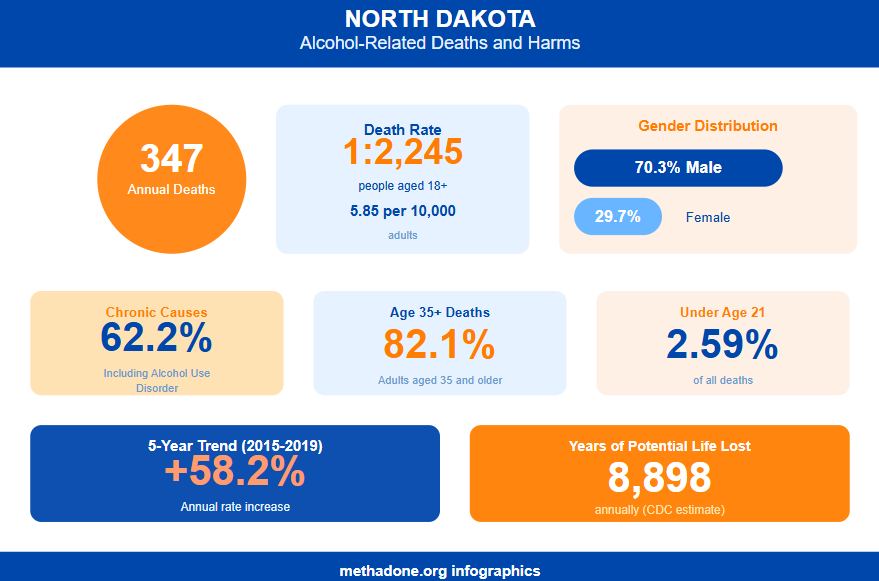
The increase in alcohol-related death rates over just five years indicates that long-term heavy drinking is claiming lives at an accelerating pace in North Dakota.
Traffic Safety
- 38% of all fatal crashes in 2022 were alcohol-related, resulting in 43 fatalities
- 35% of fatal crashes involve alcohol
- One alcohol-related crash occurred every 13 hours
- One alcohol-related vehicle fatality occurred every 10 days
- Approximately 15% of adult arrests in 2022 were for DUI
- 11.3% of juvenile arrests are alcohol-related (DUI and liquor law violations)
- 4.7% of adults report drinking to excess and driving in the past 30 days
North Dakota’s roads remain dangerously affected by excessive drinking despite known prevention strategies.
Other Impacts
- 30% of new domestic violence cases involve alcohol
- 94.6% of women and 84.7% of men entering correctional facilities have an active substance use disorder diagnosis
The near-universal presence of substance use disorders among those entering the correctional system and alcohol’s role in nearly one-third of domestic violence cases underscore how deeply excessive drinking is woven into the state’s public safety and criminal justice challenges.
Youth Alcohol Use (Ages 12-17)
- 22.5% of middle school students report lifetime alcohol use (decreased from 24.8% in 2003)
- 8.8% of youth aged 12-17 reported past-month alcohol use (2017-2019), similar to regional (8.5%) and national (9.4%) averages
- 8.49% used alcohol in the past month (2021-2022 average)
- 5.01% engaged in binge alcohol use in the past month
- Approximately 4.4% met criteria for alcohol use disorder in the past year
High School Students
- 27.6% report current alcohol use (within past 30 days), decreased from 35.3% in 2013
- 15.6% report current binge drinking (within past 30 days), decreased from 21.9% in 2013
- 12.9% report first alcohol use before age 13, decreased from 25.4% in 2003
- 5.5% report driving after drinking alcohol within the past 30 days, decreased from 10.7% in 2013
- 14.2% report riding with a driver who had been drinking within the past 30 days, decreased from 21.9% in 2013
Underage drinking remains a substantial problem, with the majority of adults (92.9%) agreeing it’s a community issue.
Young Adults (Ages 18-29)
- 60% of young adults report using alcohol
- 63.3% report binge alcohol use
- 22.7% report driving within two hours of drinking in the past 30 days
- 61.8% of college students report using alcohol
Among Ages 18-25 Specifically
- 64.02% used alcohol in the past month (2021-2022 average)
- 40.43% engaged in binge alcohol use in the past month
- 48.3% reported past-month binge alcohol use (2017-2019), higher than both the regional average (36.3%) and national average (35.4%)
- 20.46% met criteria for alcohol use disorder
Young adults in North Dakota demonstrate exceptionally high rates of binge drinking compared to national benchmarks, with nearly half engaging in this risky behavior monthly.
Adult Alcohol Consumption
Current Use Patterns
- 60.1% of adults age 26 and older used alcohol in the past month
- 22.7% of North Dakota adults over 18 binge drink at least once per month
- The median number of drinks per binge is 5.9
- The 25% most active drinkers consume a median 9.4 drinks per binge
- Binge drinking adults binge a median 1.8 times monthly
- The 25% most active drinkers binge 4.2 times per month
North Dakota ranks 2nd in the nation for binge alcohol use among adults age 26 and older at 31.2%, indicating a pervasive drinking culture that extends well beyond young adulthood.
Per Capita Consumption Trends
- North Dakota’s per capita alcohol consumption has risen 38% since 2000
- This represents the second largest increase in the country
- The increase is 2.7 times the national average
- Consumption rose from 2.4 gallons per capita in 2000 to 3.3 gallons in 2022
This dramatic 22-year increase demonstrates that North Dakota’s drinking problem is not only severe but actively worsening at a rate far exceeding national trends.
Alcohol Use Disorder Prevalence
| Age Group | Percentage with AUD | Number of People |
| 12+ | 13.50% | 86,000 |
| 12-17 | 3.71% | 2,000 |
| 18-25 | 20.46% | 19,000 |
| 26+ | 13.39% | 65,000 |
| 18+ | 14.53% | 84,000 |
Historical Trends
- Among ages 18-25: 13.8% had past-year AUD (2017-2019), higher than the national average (9.8%)
- Among ages 12+: 6.5% had past-year AUD (2017-2019), higher than the national average (5.3%)

Alcohol use disorder affects more than 1 in 8 North Dakota residents age 12 and older, with young adults experiencing the highest rates at over 20%.
Risk Factors and Environmental Context
Alcohol Availability
- North Dakota ranks highest in the nation for bars per capita: 1 bar for every 1,809 people
- 1 alcohol beverage license (restaurant, bar, or liquor store) for every 492 people
- 50% of servers in alcohol establishments have served underage youth in compliance checks
North Dakota’s exceptionally high density of alcohol outlets creates an environment where alcohol is readily accessible, while widespread non-compliance with underage serving laws demonstrates weak enforcement of existing protections.
Youth Access Perceptions
- 11.3% of adults believe it’s not at all difficult for youth to buy alcohol at a store
- 41.2% believe it’s not at all difficult for youth to get an older person to buy alcohol
- 55.9% believe it’s not at all difficult for youth to sneak alcohol from home
The majority of adults recognize that youth can easily access alcohol through multiple pathways, suggesting a normalization of underage drinking that undermines prevention efforts.
Risk Perception
- 70.7% of high school students believe binge drinking 1-2 times weekly does NOT pose great risk
- 70.8% of young adults age 18-29 share this belief
- Individuals who start drinking before age 15 are four times more likely to develop alcohol use disorder

The widespread underestimation of binge drinking risks among young people reflects dangerous misperceptions that likely contribute to North Dakota’s exceptionally high rates of excessive alcohol consumption in these age groups.
Economic and Social Costs
- Economic costs estimated at $487 million in 2010 ($658.3 million adjusted for 2022 inflation)
- Equivalent to $725 per person or $1.40-$1.89 per drink
- Nationally, excessive alcohol use led to approximately 95,158 deaths annually (2011-2015), shortening lives by an average of 40 years
The substantial economic burden demonstrates that excessive drinking imposes hidden costs on taxpayers that far exceed the price paid at the bar or store.
Maternal and Infant Health
- 24.3% of women of childbearing age (18-44) reported binge drinking in the past month (2023), compared to 17.6% nationally
- 7.2 newborns per 1,000 hospitalized were diagnosed with neonatal abstinence syndrome (2021)

North Dakota’s binge drinking rate among women of childbearing age raises serious concerns about fetal alcohol exposure and contributing to substance-related complications in newborns.
Community Attitudes and Prevention Support
Problem Recognition
- 90.8% of adults believe adult alcohol use is a problem in their community
- 73% perceive alcohol as a moderate or serious problem
The overwhelming recognition that alcohol use is a community problem demonstrates broad awareness of the issue, yet this awareness has not yet translated into the behavioral or policy changes needed to reverse consumption trends.
Prevention Support
- 72.7% believe it’s possible to reduce problems through prevention
- 73.6% believe prevention programs are a good investment
- 81.1% support the legal drinking age of 21
- 67.7% support DUI checkpoints
- 86.7% support compliance checks
- 81.0% support penalties for adults who provide alcohol to minors
- 66.2% believe servers and bartenders should be specially trained
Strong public support for evidence-based prevention strategies indicates that North Dakota residents are ready for policy interventions that could significantly reduce alcohol-related harms.
Protective Factors
- 78.4% of high school students report parents ask where they’re going
- 78% report parents have clear rules and consequences
North Dakota’s drinking culture remains deeply entrenched, suggesting that implementing evidence-based policies could significantly reduce harm.
North Dakota’s alcohol statistics reveal a state grappling with one of the nation’s most severe drinking problems, characterized by exceptionally high binge drinking rates across all age groups, rising consumption trends, and significant health and safety consequences. Addressing the state’s entrenched drinking culture will require comprehensive implementation of evidence-based policies and sustained commitment to reducing alcohol availability and changing social norms around excessive consumption.
Conclusion
In general, North Dakota confronts two intertwined substance crises: an entrenched alcohol problem characterized by the nation’s second-highest binge drinking rates and a rapidly escalating drug overdose epidemic driven by fentanyl contamination. While overall drug use remains below national averages, overdose deaths have surged 73.68% in three years, and stark disparities persist with Native Americans dying at seven times the rate of white residents. Despite strong community support for prevention and treatment expansion, critical gaps remain—77% of those needing treatment don’t receive it—highlighting the urgent need for comprehensive, evidence-based interventions that address both the state’s permissive drinking culture and the growing threat of synthetic opioids.
Sources:
- Drug Abuse Statistics
- NORTH DAKOTA – National Survey on Drug Use and Health
- Behavioral Health Barometer: North Dakota, Volume 6
- NORTH DAKOTA DRUG CONTROL UPDATE Drug Use Trends in North Dakota Substance Abuse Treatment Admissions Data
- Behavioral Health in North Dakota, Data Book 2021
- North Dakota drug overdose deaths down in 2023, but fentanyl deaths are up
- Unintentional drug overdose deaths
- WYSAC surveyed the young adults in North Dakota about alcohol, marijuana, and prescription drug abuse
- North Dakota Drug Use Statistics | Recovery Connection
- North Dakota sees 2nd biggest increase in alcohol consumption
- RBS Facts – ND Safety Council
- Alcohol use before pregnancy: North Dakota, 2018-2022 | PeriStats | March of Dimes