Statistical Data on Drugs in Iowa
Iowa ranks among the lowest states nationally for overall illicit drug use (45th) and overdose deaths (48th), yet faces significant challenges with methamphetamine use (13th highest) and prescription drug misuse (5th highest for pain relievers). The state successfully eliminated local methamphetamine production, with lab seizures dropping 99% from 1,666 in 2004 to just 3 in 2022, but now confronts rising threats from Mexican-sourced drugs and fentanyl, which is involved in 89% of opioid deaths. Despite maintaining low youth substance use rates, Iowa’s overdose death rate has nearly doubled since 2010, with over 400,000 residents needing but not receiving substance abuse treatment.
Drug Overdose Deaths
Recent Data
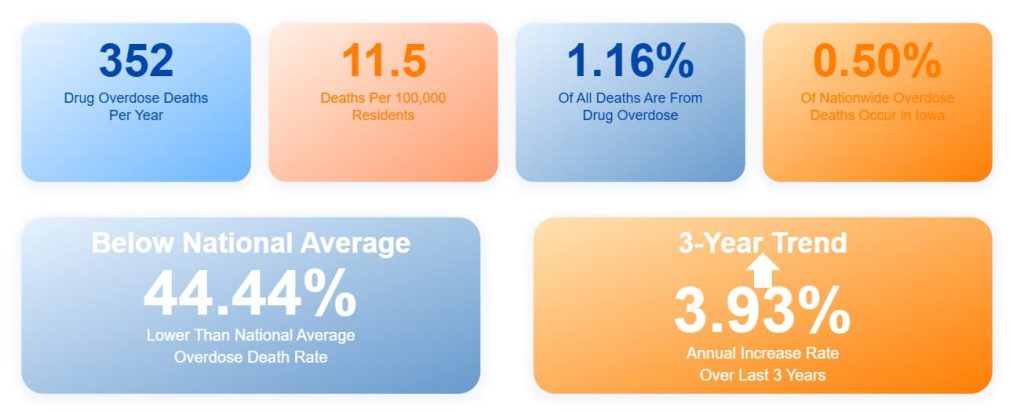
- 352 overdose deaths per year (11.5 per 100,000 residents)
- 1.16% of all deaths are from drug overdose
- 44.44% below national average overdose death rate
- 0.50% of nationwide overdose deaths occur in Iowa
- Annual increase rate: 3.93% over the last 3 years
Ratio by Years
- 2022: 469 overdose deaths (15 per 100,000 people)
- 2021: Approximately 470 deaths (15.3 per 100,000)
- 2019: Drug overdose deaths increased 4.6% nationally to 70,980 (194 lives per day)
- 2010: 258 deaths (8.5 per 100,000)
- Iowa vs. motor vehicle accidents (2010): 258 drug deaths vs. 400 vehicle deaths vs. 213 firearm deaths
Iowa’s overdose death rate has nearly doubled since 2010, representing a 59% increase since 2018 and 65% increase since 2013. Despite this growth, Iowa maintains one of the lowest overdose death rates in the US.
County-Level Overdose Deaths (2022)
| County | Deaths per 100,000 |
| Polk County | 28.1 |
| Pottawattamie County | 26.8 |
| Linn County | 17.9 |
| Scott County | 17.8 |
Urban counties show higher overdose rates, with Polk County (Des Moines area) having the highest rate at nearly double the state average.
Mortality Comparisons and Trends
Substance-Related Deaths (2022 vs. 2019)
- Opioid deaths: +51% (-8% vs. 2021)
- Stimulant deaths: +28% (+6% vs. 2021)
- Youth opioid deaths (<25): +160% (-33% vs. 2021)
Historical Context
- 2000: Opioids represented 48% of US overdose deaths
- 2021: Opioids represented 75% of US overdose deaths
- Iowa 2021: Opioids represented 55% of overdose deaths
Recent Trends
- US overdose deaths (Aug 2022): 101,552 in 12-month period (-1.0% change)
- Iowa overdose trend: +1.51% during same period
While national overdose trends may be stabilizing, Iowa continues to see increases, particularly concerning given the state’s historically low rates.
National Rankings
Iowa’s National Position
| Category | Iowa Rank | Iowa Rate | US Average |
| Current illicit drug use | 45th | 9.17% | 12.34% |
| Current marijuana use | 48th | 6.70% | 10.80% |
| Drug overdose deaths | 48th | 9.6 per 100,000 | 20.7 per 100,000 |
| Pain reliever misuse | 5th | 4.14% | 3.58% |
| Methamphetamine use | 13th | 1.11% | 0.70% |
| Binge drinking | 8th | 27.92% | 24.21% |
| Current tobacco use | 15th | 25.16% | 21.28% |
| Cocaine use | 44th | 1.45% | 2.00% |
| Heroin use | 39th | 0.25% | 0.28% |
| Youth illicit drug use (12-17) | 14th | 6.7% | – |
Iowa shows a mixed profile – very low illegal drug use overall but concerning rates of prescription drug misuse, methamphetamine use, and binge drinking.
Opioid-Related Statistics
Opioid Deaths by Year
| Year | Total Opioid Deaths | Fentanyl Involvement |
| 2016 | 183 (6.2 per 100,000) | Not specified |
| 2019 | ~157 | Not available |
| 2021 | 258-259 (8.6 per 100,000) | 83% |
| 2022 | 237 | 89% |
Fentanyl has become the dominant factor in opioid deaths, involved in nearly 9 out of 10 opioid fatalities by 2022. Youth opioid deaths showed a dramatic 160% increase in 2022 compared to 2019.
Breakdown by Opioid Type
- Prescription opioids: 44.8% of opioid overdose deaths
- Heroin: 25.9% of opioid deaths
- Synthetic opioids: 55.9% of opioid deaths
Prescription Trends
- 2013: 73.6 opioid prescriptions per 100 persons (2.3 million total)
- 2015: 68.0 opioid prescriptions per 100 persons (2.1 million total)
- 2019: Continued decline in controlled substance prescriptions to lowest levels since 2013
Demographic Breakdown of Synthetic Opioid Deaths (2022)
- 48% were under age 35
- 17% were African American
- 29% were female
Neonatal Abstinence Syndrome
- 1999: 0.3 cases per 1,000 births
- 2013: 2.2 cases per 1,000 births (seven-fold increase)
- National average (2013): 6.0 cases per 1,000 births
Despite significant reductions in prescription opioids, illicit fentanyl has more than compensated, driving overall opioid death increases.
Methamphetamine Statistics
Meth Lab Seizures
| Year | Lab Seizures |
| 2004 | 1,666 (peak) |
| 2007 | 198 |
| 2009 | 267 |
| 2012 | 400 |
| 2021 | 11 |
| 2022 | 3 |
Meth lab seizures have dramatically declined since 2005 federal legislation, dropping 99% from peak levels. This reflects a shift from local production to trafficking of Mexican-sourced methamphetamine.
Methamphetamine Seizures by Weight
- 2021: 79 pounds seized by Story County Sheriff’s Office alone
- 2021: Over 150,000 grams (331 pounds) seized statewide
- Treatment rate: Iowa 29% vs. surrounding states 19% vs. national 10%
Meth-Related Deaths and Treatment
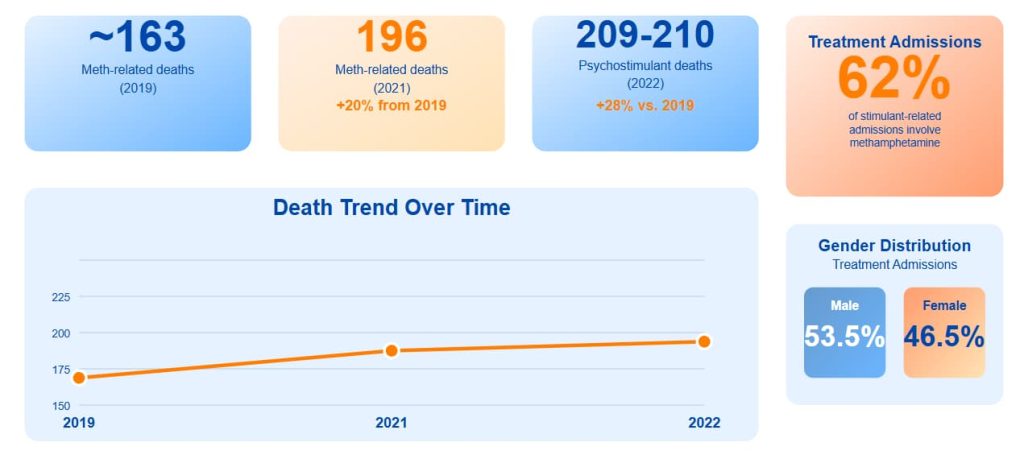
- 2019: ~163 meth-related deaths
- 2021: 196 meth-related deaths (+20% from 2019)
- 2022: 209-210 psychostimulant deaths (+28% vs. 2019)
- Treatment admissions: 62% of stimulant-related admissions involve methamphetamine
- Gender distribution: 53.5% male, 46.5% female admissions
Iowa ranks 13th nationally in annual meth use (1.11% vs. 0.70% US average) and has the 8th highest rate of meth use disorder treatment admissions, indicating methamphetamine remains a significant challenge.
Marijuana Statistics
Usage Rates by Age Group (2021)
| Age Group | Past Month Use | Past Year Use |
| 12-17 years | 5.07% (13,000) | 10.69% (28,000) |
| 18-25 years | 19.20% (68,000) | 30.86% (109,000) |
| 26+ years | 10.72% (222,000) | 18.47% (382,000) |
| Overall (12+) | 11.28% (303,000) | 19.34% (519,000) |
Iowa consistently ranks among the lowest states for marijuana use, with youth rates particularly low. The state ranks 48th nationally in current marijuana use. Some individuals who use weed, especially among young adults, may use a detox shampoo to pass a hair follicle test for job-related purposes.
Youth Trends and Perceptions
- 2021: 8% of 11th graders used marijuana in past 30 days (lowest in 20 years)
- 2019: 9.6% of 11th graders used marijuana in past 30 days
- Risk perception: 18% of Iowa 6th graders perceive no risk in weekly marijuana use
- Risk perception: Nearly 1 in 4 Iowa 11th graders perceive no risk in weekly marijuana use or in using at-home weed detox kits
- Driving misconception: 33% of US teens think smoking marijuana and driving is legal
Hospital and Emergency Data
- 2021: 6,503 marijuana-related emergency department visits
- 2022: 6,799 marijuana-related emergency department visits
- 2016-2021: +58% increase in marijuana-related ED visits
- National trend: 3,054 US children under 6 accidentally consumed edibles in 2021 (+1,375% vs. 2017)
Cannabis Use Disorder
- Legal states: 25% higher cannabis use disorder among 12-17 year olds
- Primary treatment drug: 77% of Iowa juveniles in treatment
Iowa consistently ranks among the lowest states for marijuana use, with youth rates particularly low. The state ranks 48th nationally in current marijuana use. However, it’s worth mentioning that some individuals still use THC detox shampoos to pass workpalce hair drug tests.
Other Substance Statistics
Prescription Drug Misuse
- Past year pain reliever misuse: 2.82% overall (76,000 people)
- Youth (12-17): 1.71% misuse rate
- Adults (18+): 2.94% misuse rate
- Non-medical prescription drug use: 14.6% of adults (19th nationally)
Cocaine Use
- Past year use: 1.52% overall (41,000 people)
- 18-25 age group: 3.16% past year use
- Treatment admissions (2009): 1,094 people for crack/cocaine
- National ranking: 44th in current cocaine use (1.45% vs. 2.00% US)
Heroin Use
- Past year use: 0.11% overall (3,000 people)
- Deaths from heroin overdose (2012): 14 deaths
- Deaths from heroin overdose (2016): 47 deaths
- National ranking: 39th in heroin use (0.25% vs. 0.28% US)
Substance Use Disorders (2021)
Prevalence by Age Group
| Age Group | Drug Use Disorder | Substance Use Disorder |
| 12-17 years | 8.57% (22,000) | 10.99% (29,000) |
| 18-25 years | 16.58% (58,000) | 28.64% (101,000) |
| 26+ years | 9.09% (188,000) | 18.09% (374,000) |
| Overall | 10.02% (269,000) | 18.79% (504,000) |
Specific Disorder Prevalence (2021)
- Pain Reliever Use Disorder: 1.53% overall (41,000 people)
- Opioid Use Disorder: 1.90% overall (51,000 people)
- Marijuana Use Disorder: 1.1% overall (28,000 people)
Treatment Gaps
- Needing but not receiving illicit drug treatment: 193,000 people (7.18%)
- Overall treatment gap: 417,000 people (15.55%)
Young adults (18-25) show the highest rates of substance use disorders at nearly 29%, highlighting this as a critical intervention period.
Criminal Justice and Treatment Statistics
Correctional Population Substance Use Needs
- State prisoners with substance abuse treatment needs: 60.2%
- Probationers/parolees with treatment needs: 42.1%
- Drug use among state prisoners: 58%
- Drug use among jail inmates: 63%
- General population drug use: 5%
Treatment Admissions and Capacity
- 2009 total admissions: 27,843 people
- Gender distribution: 68.6% male, 31.4% female
- 2019 single-day count: 8,838 people enrolled in treatment (down from 8,975 in 2015)
Primary Substances in Treatment
- Marijuana: Over 50% of admissions
- Stimulants (including meth): 28% of admissions
- Drug problem only: 31.7% of those in treatment
- Both drug and alcohol: 50.5% of those in treatment
Medication-Assisted Treatment
- Methadone recipients (2019): 1,362 people (up from 783 in 2015)
- Buprenorphine recipients (2019): 549 people (up from 106 in 2015)
Facility Information (2006)
- Total rehab facilities: 125
- Residential treatment facilities: 28
- Opioid treatment facilities: 4
The criminal justice system serves as a major touchpoint for people with substance use disorders, with treatment needs far exceeding general population rates.
Demographic Patterns
Treatment Admissions by Demographics
| Demographic | Primary Substance | Percentage |
| White Iowans | All substances | 91.3% of admissions |
| Black Iowans | Cocaine | 40.5% of cocaine admissions |
| Black Iowans | Heroin | 21.9% of heroin admissions |
| Black Iowans | Marijuana | 7% of marijuana admissions |
| Males | All substances | 68.4% of admissions |
| Females | Methamphetamine | 46.5% of meth admissions |
| Adults 50+ | Various | 10.9% of admissions |
| Youth (12-17) | Marijuana | 23.5% of marijuan admissions |
Racial disparities exist in substance-specific treatment patterns, with Black Iowans overrepresented in cocaine treatment relative to their population percentage. Hair drug testing results also support this statement.
Workplace and Driving Statistics
Workplace Drug Testing Results
| Substance | Iowa Rate | US Rate |
| Methamphetamine | 1.6% | 1.1% |
| Cocaine | 0.16% | 0.26% |
| Marijuana | 1.6% | 2.5% |
| Opiates | 0.2% | 0.22% |
| Overall positive | 3.9% | 4.5% |
Drug-Impaired Driving
- Marijuana in fatal crashes (2016): 51% in Iowa vs. 41.1% nationally
- Marijuana-impaired drivers nationally: 12 million (2018), up 47% from 2014
Top 3 Drugs in Iowa OWI Tests (besides alcohol)
- THC: 33%
- Amphetamines: 19%
- Benzodiazepines: 18%
Iowa shows lower overall workplace drug positivity but higher methamphetamine rates, reflecting the state’s specific drug challenges.
Health-Related Statistics
HIV and Injection Drug Use
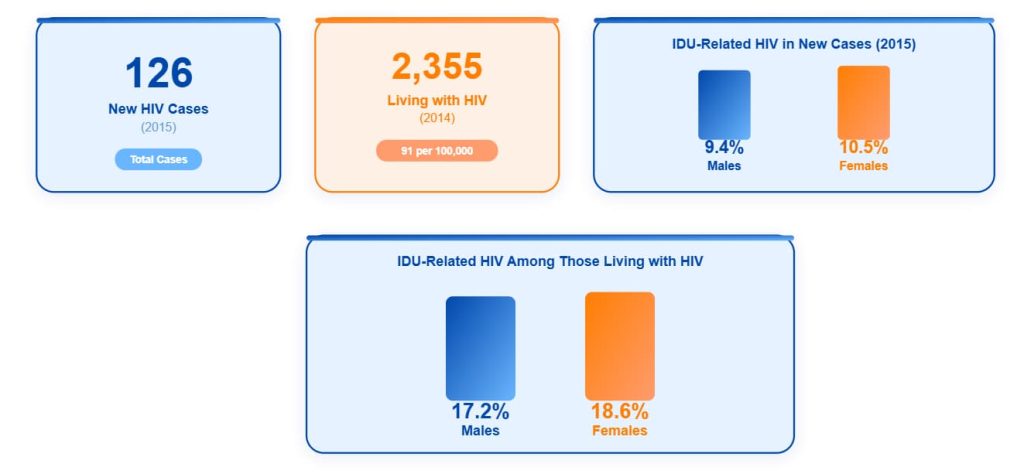
- Iowa HIV cases (2015): 126 total new cases
- IDU-related HIV in males: 9.4% of new cases
- IDU-related HIV in females: 10.5% of new cases
- Total living with HIV (2014): 2,355 persons (91 per 100,000)
- Males living with IDU-related HIV: 17.2%
- Females living with IDU-related HIV: 18.6%

Hepatitis C
- Total HCV cases (2015): 2,235
- IDU-related cases (≥30 years old): 51.1% of 303 cases
- Estimated total living with HCV: 35,865-136,900 persons
- Diagnosed with HCV (2015): 21,748 persons
Poison Control and Suicide
- OTC analgesic involvement in suicides: 57% increase from 2000-2018
- Prescription/OTC drug poison calls: Over 50% of Iowa poison exposure calls
- Leading poison exposure: Pain relievers (#1)
Injection drug use contributes significantly to blood-borne disease transmission, with rates comparable to or exceeding national averages.
Iowa presents a paradoxical drug situation with overall low illicit drug use rates (45th nationally) but significant challenges with prescription drug misuse (5th highest) and methamphetamine use (13th highest). While the state successfully eliminated local meth production, it now faces rising threats from Mexican-sourced drugs and fentanyl, which accounts for 89% of opioid deaths. Despite relatively low overdose rates compared to other states, Iowa’s overdose deaths have nearly doubled since 2010, with over 400,000 residents needing but not receiving substance abuse treatment.
Statistical Data on Alcohol in Iowa
Iowa demonstrates concerning alcohol consumption patterns that significantly exceed national averages, particularly in binge drinking behaviors. The state consistently ranks among the nation’s leaders in excessive alcohol use, with corresponding increases in alcohol-related deaths and substantial economic impacts. This comprehensive analysis examines alcohol usage patterns, demographics, health consequences, and societal costs based on available state data. Unfortunately, many individuals engaged in regular drinking also look for the best way to pass a drug test that doesn’t involve abolishing this unhealthy habit.
Alcohol-Related Deaths and Health Impact
Annual Death Statistics
- 2019: 827 alcohol-related deaths
- 2020: 836 alcohol-related deaths
- 2021: 923 alcohol-related deaths
- 2022: 1,128 alcohol-related deaths
Average annual deaths: 1,305
Death Rate Trends
- 2008-2019: 73% increase in alcohol-related deaths
- 2019-2021: 38-53% increase
- 5-year average increase (2015-2019): 51.8%
Death Rates per 100,000 Population
- Iowa (2020): 15.1 per 100,000
- National average: 13.1 per 100,000
- Urban areas: 27.1 per 100,000
- Rural areas: 26.4 per 100,000
Demographics of Deaths
- Male deaths: 69.4% of total (36.7 per 100,000)
- Female deaths: 30.6% of total (17.1 per 100,000)
- Deaths under age 21: 2.45%
- Deaths age 35+: 88%
- Chronic causes: 67%
5-Year Average Deaths by Cause (2015-2019)
| Cause Category | Annual Deaths |
| All alcohol-attributable causes | 431 |
| Suicides due to alcohol | 113 |
| Coronary Heart Disease due to alcohol | 110 |
| Alcohol Dependence Syndrome | 58 |
| Homicides due to alcohol | 37 |
Iowa’s alcohol-related death rates exceed national averages and show alarming upward trends, with deaths nearly doubling in recent years and disproportionately affecting males and middle-aged adults.
Overall Alcohol Consumption Rankings
National Rankings
- Binge Drinking Rate: #1 nationally at 22.5-23% (various sources)
- Excessive Drinking: #2 nationally at 22.8% of adults
- Adult Binge Drinking: #4 nationally at 22% of adults
- Overall Excessive Drinking: 46th ranking (21.3% – this appears to be an inverse ranking where lower numbers indicate higher rates)
Top 5 States for Binge Drinking
| Rank | State | Rate |
| 1 | Iowa | 22.5% |
| 2 | North Dakota | 22.4% |
| 3 | Montana | 21.9% |
| 4 | South Dakota | 21.5% |
| 5 | Nebraska | 20.5% |
Iowa consistently ranks in the top tier nationally for problematic drinking behaviors, indicating a statewide pattern that requires significant public health attention.
Adult Alcohol Usage Statistics (2020-2021)
| Metric | Iowa Rate | US Average | Difference |
| Alcohol use (past 30 days) | 57-58.69% | 53% | +4-5.69% |
| Binge drinking (past 30 days) | 22-24.43% | 16-17% | +5-8.43% |
| Excessive drinking | 25% | 25% | Equal |
Youth Alcohol Statistics
Ages 12-17 (2021)
- Past month alcohol use: 10.79% (28,000 youth)
- Past month binge drinking: 4.84% (13,000 youth)
- Past year alcohol use: 10.69%
Ages 12-20 (Underage Drinking)
- Past month alcohol use: 19.29-23% vs. 17% national average
- Past month binge drinking: 9.40-15% vs. 10% national average
By Grade Level (2021)
- 6th grade alcohol use: 2%
- 8th grade alcohol use: 6%
- 11th grade alcohol use: 18%
- 11th grade binge drinking: 9%
- 11th graders who have ever consumed alcohol: 41%
Iowa youth demonstrate higher alcohol consumption rates than national averages, with particularly concerning escalation through high school years and high rates of binge drinking among those who do consume alcohol.
Young Adults (Ages 18-25) Statistics
Consumption Patterns (2017-2019)
- Past month binge drinking: 41.9% vs. 35.4% national average
- Past year alcohol use disorder: 14.7% vs. 9.8% national average
2021 Data
- Past month alcohol use: 55.81% (197,000 people)
- Past month binge drinking: 31.66% (112,000 people)
Young adults in Iowa show the most concerning drinking patterns, with binge drinking rates nearly 7 percentage points above national averages and alcohol use disorder rates significantly elevated.
Binge Drinking Demographics (2020)
By Gender
- Males: 28-29%
- Females: 14-15%
By Age Group
- Ages 18-24: 33%
- Ages 25-44: 31%
- Ages 45-64: 20%
- Ages 65+: 5%
By Education Level
- Less than high school: 13%
- High school graduate/GED: 22%
- Some post-high school: 24%
- College graduate: 20%
By Race/Ethnicity
- White, Non-Hispanic: 22%
- Hispanic: 20%
- Black, Non-Hispanic: 16%
- Another race: 14%
By Relationship Status
- Never married: 31%
- Partnered (married/unmarried): 20%
- Divorced/widowed/separated: 15%
By Employment Status
- Employed for wages: 29%
- Student: 27%
- Self-employed: 24%
- Out of work <1 year: 23%
- Retired: 1%
Binge drinking patterns reveal highest rates among young adults, males, and working-age populations, with concerning rates across educational levels suggesting this issue spans socioeconomic boundaries.
Geographic and Demographic Variations
Highest County Rates
- Buchanan County: 27% excessive drinking
- Dubuque County: 27% excessive drinking
Income-Based Patterns
- Binge drinking highest: $50,000-$74,999 income bracket
- Heavy drinking highest: $75,000+ income bracket
Mental Health Correlations
- 14+ poor mental health days: 26% binge drinking rate
- 1-13 poor mental health days: 25% binge drinking rate
- 0 poor mental health days: 19% binge drinking rate
Smoking Status Correlation
- Current smokers: 34% binge drinking rate
- Former/never smokers: 19% binge drinking rate
Alcohol misuse patterns show clear correlations with mental health status and other risk behaviors, while geographic variations suggest community-level factors influence consumption patterns.
Risk Perceptions
Perception of Risk from 5+ Drinks Once/Twice Weekly:
- Ages 12+: 36.67% perceive great risk
- Ages 12-17: 37.67% perceive great risk
- Ages 18-25: 31.28% perceive great risk
- Ages 26+: 37.47% perceive great risk
Lower risk perception among young adults (18-25) correlates with their higher consumption rates, suggesting targeted education efforts may be needed for this demographic.
Treatment and Substance Use Disorders
Alcohol Use Disorder Prevalence (2017-2019)
- Ages 12+: 6.5% (170,000 people) vs. 5.3% national average
- Ages 18-25: 14.7% (52,000 people) vs. 9.8% national average
Treatment Admissions (2009)
- Alcohol only: 8,668 people
- Alcohol with secondary drug: 6,384 people
- Gender distribution: 74.3% male, 25.7% female
Treatment Outcomes
After 6 months of treatment: 45% still used alcohol
Iowa shows higher rates of alcohol use disorders than national averages, particularly among young adults, with treatment success rates indicating significant challenges in long-term recovery.
Economic Impact
Financial Costs
- 2010: $1.934 billion in costs
- 2022 adjusted value: $2.610 billion
- 2020 estimated loss: $1.9 billion
- Cost per drink: $2.15 (2022 dollars)
- Annual potential life years lost: 30,070 years
The economic burden of excessive alcohol use in Iowa represents a substantial drain on state resources, equivalent to billions in annual costs across multiple sectors.
Driving and Safety Statistics
Impaired Driving
- 2022: 35% of fatal crashes involved impaired drivers
- 2016-2020: 27% of motor vehicle crash deaths involved alcohol
- 2022 OWI charges: 1,100 drivers (25% were repeat offenders)
Alcohol-impaired driving remains a significant public safety issue, contributing to more than one-quarter of fatal crashes despite prevention efforts.
Iowa presents a stark alcohol crisis with the nation’s highest binge drinking rate (22.5%) and second-highest excessive drinking rate (22.8%), resulting in alcohol-related deaths that have nearly doubled from ~600 in 2019 to 1,128 in 2022. While the state shows concerning consumption patterns across all demographics—particularly among young adults (41.9% binge drinking vs. 35.4% nationally) and males (28-29% binge drinking rate)—the economic impact reaches $2.6 billion annually. Despite having higher alcohol use disorder rates than national averages (6.5% vs. 5.3%), treatment success remains limited with only 55% of patients maintaining sobriety after six months, while alcohol continues to contribute to 35% of fatal crashes and disproportionately affects working-age adults and rural communities.
In general, Iowa demonstrates a dual crisis characterized by contrasting drug and alcohol patterns: while ranking among the lowest nationally for illicit drug use (45th) and overdose deaths (48th), the state leads the nation in binge drinking (22.5%) and ranks second in excessive alcohol consumption (22.8%). Despite successfully eliminating local methamphetamine production (99% reduction in lab seizures), Iowa faces emerging threats from Mexican-sourced drugs and fentanyl-involved deaths (89% of opioid fatalities). The state’s alcohol crisis has intensified dramatically, with deaths nearly doubling from ~600 in 2019 to 1,128 in 2022, generating $2.6 billion in annual economic costs. Most concerning is the treatment gap affecting over 400,000 residents who need but cannot access substance abuse services, while young adults show the highest risk patterns across both alcohol (41.9% binge drinking) and drug use disorders (28.6% overall substance use disorder rate).
Sources:
- Puerto Rico Drug Abuse Statistics | Recovery Connection
- IOWA DRUG CONTROL UPDATE Drug Use Trends in Iowa
- Drug Information | Iowa Department of Public Safety
- Drug Trends in Iowa
- Iowa’s Evolving Drug Trends – Responding to Health & Safety Concerns
- IOWA – National Survey on Drug Use and Health
- How many drug overdose deaths happen every year in Iowa? | USAFacts
- Mental Health and Substance Use State Fact Sheets: Iowa | KFF
- Iowa Drug Statistics, Iowa Drug Use Statistics | Recovery Connection
- The Latest Drug Addiction Statistics in Iowa
- ADDICTED: Iowa leads the pack in meth usage
- Explore Non-Medical Drug Use – Past Year in Iowa | AHR
- National Institute on Drug Abuse (NIDA) – Iowa Opioid Summary
- Behavioral Health Barometer: Iowa, Volume 6
- Binge drinking rates in Iowa highest in the country
- Alcohol consumption leads to greater cancer risk for Iowans | Iowa Now
- Alcohol Use and Binge Drinking in Iowa
- Iowa now ranks second in the nation in excessive drinking, according to a new state report
- Alcohol Statistics in Iowa
- These Iowa counties drink more than others, study finds | SiouxlandProud
- Iowa Alcohol Statistics & Facts – Server Certify
- Binge drinking rates are higher in Iowa than other states – Axios Des Moines