Statistical Data on Drugs in USA
Drug abuse and addiction represent one of the most pressing public health challenges in the United States, based on the results of various survey methods, including hair drug testing. With over 96,700 annual overdose deaths and 48.5 million Americans suffering from Substance Use Disorder (SUD), the scale of this crisis demands comprehensive understanding and response.Key statistics highlight the magnitude of the problem:
Key Overdose Death Statistics
Annual Overdose Deaths
- Total overdose deaths: 96,700+
- Daily opioid deaths: 136
- Heroin-specific deaths: 14,019
- Fentanyl involvement: 53% of all overdose deaths
Comparative Death Rates (2021)
- Drug overdoses exceeded homicides by 306.7%
- Overdose deaths rank just below diabetes in total fatalities
- Motor vehicle accidents and suicides combined: 84.5% of overdose deaths
Drug Involvement in Overdose Deaths
| Drug Type | Percentage of Total Overdose Deaths |
| Opioids | 67.8% |
| Cocaine | 21.2% |
| Psychostimulants | 20.6% |
| Methadone | 4.03% |
COVID-19 Impact on Overdoses
The pandemic has significantly exacerbated the drug crisis:
- 38.4% increase in overdose deaths during the first year of the pandemic
- 200% spike in overdoses during initial quarantine periods
These statistics suggest that social isolation and healthcare disruption have severely impacted addiction vulnerability and treatment accessibility
Overall Substance Use Prevalence
Substance Use Disorders by Type
- Drug use disorder: 27.2 million (9.7%)
- Drug & alcohol combined: 7.5 million (2.7%)
- Mental health & substance use: 20.4 million (7.9%)
General Population Statistics (Ages 12+)
- Total Americans with Substance Use Disorder: 48.5 million (16.7%)
- Current illegal drug users: 37.3 million
- Lifetime illicit drug use: 50% of population
- Total drug users including alcohol and tobacco: 165 million
Age-Specific Statistics
Usage by Age Groups
| Age Group | SUD Prevalence | Drug Use Disorder |
| Adolescents (12-17) | 2.2M (8.5%) | 2.2M (6.9%) |
| Young Adults (18-25) | 9.2M (27.1%) | 6.1M (18%) |
| Adults (26+) | 37M (16.6%) | 19.3M (8.6%) |
| Elderly (65+) | 4.6M (8%) | 1.8M (3.9%) |
Key Youth Insights:
- 70% of drug users try illicit drugs before age 13
- 47% use illegal drugs by high school graduation
- 1,150 deaths (ages 14-18) from overdose in first half of 2021
Substance-Specific Statistics
Current Usage by Drug Type
- Marijuana: 55 million (16.9%), many users resort to at-home THC detox
- Prescription Drugs: 16.3 million (5.76%)
- Opioids: 10.1 million (3.43%)
- Cocaine: 5 million (1.73%)
- Methamphetamine: 2.5 million (0.89%)
- Hallucinogens: 1.4 million (0.49%)
- Heroin: 902,000 (0.32%)
Prescription Drug Abuse Breakdown
| Drug Type | Annual Abusers | % Among Rx Abusers |
| Painkillers | 9.7 million | 59.5% |
| Sedatives | 5.9 million | 36.2% |
| Stimulants | 4.9 million | 30.1% |
| Benzodiazepine | 4.8 million | 29.4% |
Drug Use Demographics
Age and Usage
- 50% of people aged 12 and older have used illicit drugs at least once
- 37.3 million Americans (12 and older) were current illegal drug users in 2020
- Drug use is highest among 18-25-year-olds at 39%
- 47% of young people use an illegal drug by high school graduation
Gender and Usage
- 22% of males used drugs in the past year
- 17% of females used drugs in the past year
- Men are more than twice as likely as women to die from drug overdose
Racial and Ethnic Trends
- Among women, American Indian and Alaska Natives are most likely to die from an overdose
- Among men, Black or African Americans are most likely to die from an overdose
- Asian or Pacific Islanders are least likely to die from an overdose
 Mental Health and Substance Abuse
- 9.5 million adults have both a substance abuse disorder and a mental illness
- 20.6% of adults have a mental illness
- 51.5% of adolescents with Major Depressive Episodes are more likely to use illegal drugs
Economic Impact
- $193 billion for illegal drugs
- $78.5 billion for prescription opioids
Drug-Related Crime and Incarceration
| Statistic | Number | Percentage |
| Americans Arrested Annually for Drug-Related Crimes | 1.16 million | - |
| Prison Inmates Who Abuse Drugs or Alcohol | - | 80% |
| Americans Sent to Prison Annually for Drug Crimes | 244,000 | - |
| Drug-Related Arrests as Percentage of All Arrests | - | 26% |
| Marijuana-Related Arrests | - | 11% of total arrests |
Drug Control Expenses
- $1 trillion spent on combating drug-related crimes since 1971
- $270 billion spent on drug control in 2017
- $35 billion federal budget for drug control in 2020
Treatment and Recovery Statistics
- People needing treatment: 54.2 million
- People receiving treatment: 12.5 million (23%)
- Relapse rate: 40-60%
- Only 20% of individuals in drug treatment are women
- 1 in 3 adults with mental illness and substance abuse receive no care
Treatment Costs
- Medical detoxification: $1,750 minimum
- Inpatient rehabilitation (30 days): $12,500
- Residential treatment: $42,500
- Outpatient rehab (3 months): $5,000
The data reveals a complex and escalating drug abuse crisis in the United States, affecting diverse demographics and imposing significant social and economic costs. The statistics highlight the critical need for comprehensive prevention, treatment, and support strategies. Additionally, it explains why many individuals detox at home with special shampoos or weed detox kits.
Statistical Data on Alcohol in USA
Alcohol consumption is a significant public health concern in the United States, affecting individuals across various demographics, age groups, and social contexts. This analysis highlightes the widespread nature of alcohol use, its health impacts, and societal consequences.
Mortality (2020-2021) and Health Impacts
Alcohol-Related Deaths
- Approximately 178,000 deaths each year
- 29% increase from 2016-2017
- Shortened lives by an average of 24 years
- Resulted in about 4 million years of potential life lost
Breakdown of Alcohol-Related Deaths
Cause of Deaths:
- 117,000 deaths (two-thirds) from chronic conditions
- 61,000 deaths (one-third) from binge drinking or excessive consumption
Deaths by Sex:
- 119,600 deaths among men
- 58,700 deaths among women
The significant gender disparity in alcohol-related deaths (men accounting for about 67% of deaths) reflects higher risk-taking behavior and consumption patterns among males.
Death Rates by Race (per 100,000 people, 2019)
| Race/Ethnicity | Death Rate |
| American Indian/Alaska Native | 50.5 |
| White | 11.1 |
| Hispanic/Latino | 10.6 |
| Black/African American | 7.5 |
| Asian/Pacific Islander | 2.4 |
There is a striking disparity in death rates, with American Indian/Alaska Native populations experiencing nearly 5 times the death rate of the next highest group.
Death Rates by Age Group (per 100,000 people)
| Age Group | Death Rate |
| 55-64 | 32.5 |
| 65-74 | 22.5 |
| 45-54 | 22.0 |
| 35-44 | 11.1 |
| 75+ | 10.8 |
| 25-34 | 4.2 |
| 18-24 | 0.5 |
The death rate peaks in the 55-64 age group, suggesting cumulative health impacts of long-term alcohol use.
Specific Health Consequences
Annual Health-Related Deaths:
- 18,164 from alcoholic liver disease
- 3,584 from alcohol-induced hypertension
- 4,258 from alcohol dependence syndrome
- 5,272 from alcohol-related cancer
- 8,731 from heart disease and stroke
Prevalence of Alcohol Use
Total Population Drinking:
- 224.3 million people ages 12 and older (79.1%) have consumed alcohol in their lifetime
- 218.7 million adults ages 18 and older (84.9%) have consumed alcohol in their lifetime
- 5.6 million youth ages 12 to 17 (21.6%) have consumed alcohol in their lifetime
Total Alcohol Use Disorder AUD Cases:
- 28.9 million people ages 12 and older (10.2%) have AUD
- 28.1 million adults ages 18 and older (10.9%) have AUD
- 757,000 youth ages 12 to 17 (2.9%) have AUD
The data shows that alcohol consumption is deeply embedded in American society, with nearly 4/5 of the population having tried alcohol, while a concerning 10.2% develop AUD.
Drinking Patterns
Binge Drinking
- 25.8% of adults 18+ reported binge drinking in the past month
- 29.7% of men and 22.2% of women reported binge drinking
- 6.3% of adults reported heavy drinking
Underage Drinking (Ages 12-17, 2023)
- 5.6 million (21.6%) have consumed alcohol in their lifetime
- 757,000 (2.9%) have AUD
- Girls (3.8%) are nearly twice as likely as boys (2.0%) to have AUD
- 4,700 annual deaths from teen alcohol use
The higher prevalence of AUD among teenage girls represents a concerning trend that differs from adult statistics where males show higher rates.
Demographic Insights
Alcohol Use by Race (Lifetime Drinking)
| Race | Percentage Who Drank Alcohol |
| White | 84.7% |
| Hispanic/Latino | 72.6% |
| Black/African American | 70.5% |
| American Indian/Alaska Native | 66.5% |
| Asian | 62.2% |
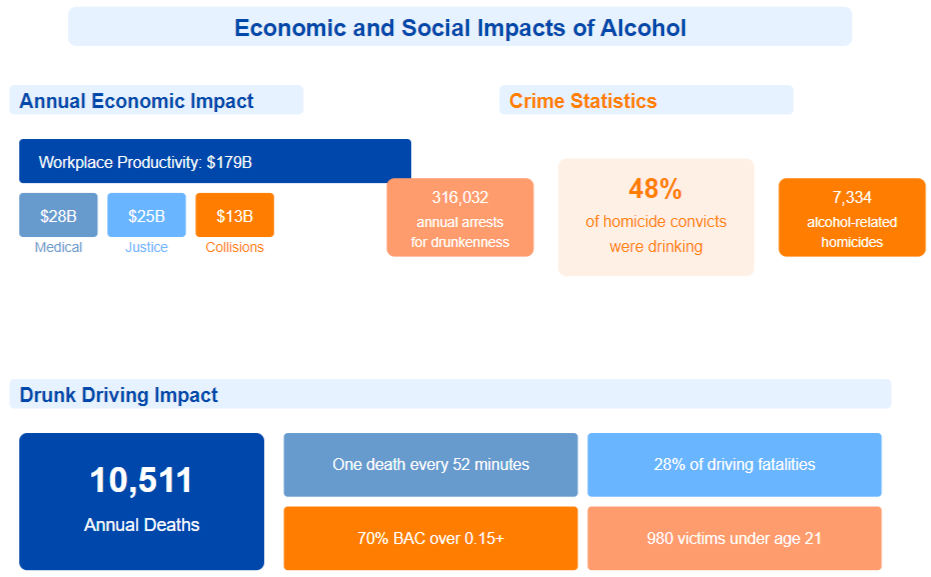
Economic and Social Impacts
Cost of Alcohol Abuse
- Estimated $29 billion in 2010
- $179 billion in workplace productivity costs
- $28 billion in medical costs
- $25 billion in criminal justice costs
- $13 billion in motor vehicle collisions
The economic burden of alcohol misuse extends far beyond individual healthcare costs, with workplace productivity representing the largest economic impact.
Crime and Legal Consequences
- 316,032 arrests for drunkenness annually
- 7,334 homicides with alcohol as a contributing factor
- 48% of homicide convicts were drinking before committing murder
Drunk Driving Statistics
- Annual deaths: 10,511
- One death every 52 minutes
- 28% of all driving fatalities
- 70% of fatalities involved BAC over 0.15+
- 980 victims under age 21
Drunk driving remains a significant cause of preventable death, with a particularly concerning impact on young people.
These statistics reveal alcohol's profound and complex impact on American society, affecting health, mortality, economy, and social dynamics across all demographic groups.
Sources:
- Drug Abuse Statistics
- Alcohol and Drug Abuse Statistics (Facts About Addiction)
- Drug Use Statistics and Demographics
- Drug Abuse in the United States_Ministry of Foreign Affairs of the People's Republic of China
- Addiction Statistics - Facts On Drug And Alcohol Use
- Understanding Alcohol’s Adverse Impact on Health
- Alcohol Use Disorder (AUD) in the United States: Age Groups and Demographic Characteristics
- Facts About U.S. Deaths from Excessive Alcohol Use
- Alcoholism Statistics You Need to Know | Talbott Recovery
- Alcoholism Statistics & Alcohol Abuse Demographics