Statistical Data on Drugs in Guam
Guam faces a persistent substance abuse crisis with youth marijuana and methamphetamine use rates consistently exceeding national averages over the past two decades, and school campuses serving as primary drug distribution points where over one-third of students are offered illegal drugs. This comprehensive statistical overview (in part, based on results of hair drug tests) reveals persistent substance abuse challenges in Guam, particularly regarding marijuana and methamphetamine use among youth, significant ethnic disparities in drug consumption patterns, school campuses as drug distribution points, and a dramatic increase in methamphetamine-related deaths by 2023.
Methamphetamine-Related Deaths
2022
- Total meth-related deaths: 36
- Deaths coded as directly from methamphetamine: 1 (2.78%)
2023
- Total meth-related deaths: 51 (42% increase from 2022)
- Deaths coded as directly from methamphetamine: 24 (47.06%)
- Methamphetamine became the third leading cause of death in Guam
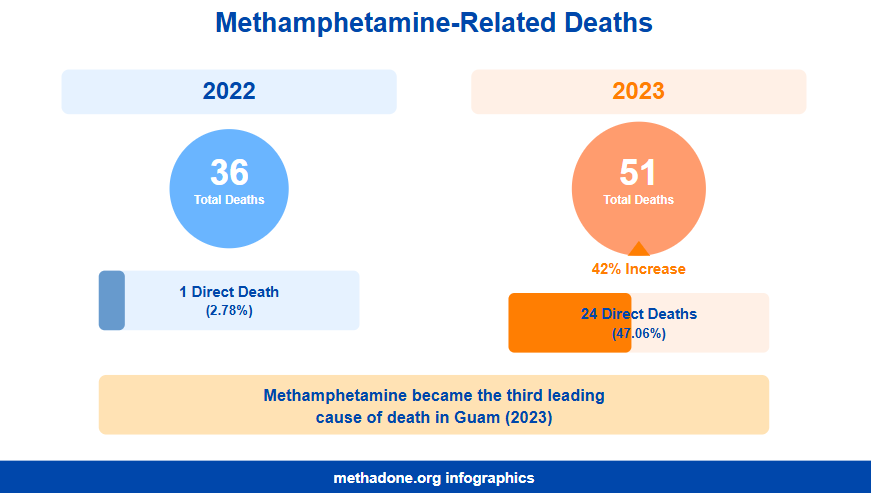
Methamphetamine-related deaths increased 42% from 2022 to 2023, with a dramatic shift in how deaths were classified.
Youth Substance Use Statistics
High School Students – Marijuana Use
Lifetime Marijuana Use Trends
| Year | Guam HS (%) | US HS (%) | Difference |
| 1999 | 50.9% | 47.2% | +3.7 |
| 2001 | 50.6% | 42.4% | +8.2 |
| 2003 | 46.9% | 40.2% | +6.7 |
| 2005 | 47.3% | 38.4% | +8.9 |
| 2007 | 45.5% | 38.1% | +7.4 |
| 2009 | 48.8% | 36.8% | +12.0 |
| 2011 | 49.8% | 39.9% | +9.9 |
| 2013 | 49.2% | 40.7% | +8.5 |
| 2015 | 46.3% | 38.6% | +7.7 |
| 2017 | 45.3% | 35.6% | +9.7 |
| 2019 | – | 36.8% | – |
Nearly half of Guam high school students consistently reported lifetime marijuana use from 1999-2017, persistently exceeding US rates by 6-12 percentage points. Ubsurprisingly, the use of THC detox kits is also prevalent there.
Current Marijuana Use (Past 30 Days)
| Year | Guam HS (%) | US HS (%) | Difference |
| 1999 | 25.1% | 26.7% | -1.6 |
| 2001 | 26.6% | 23.9% | +2.7 |
| 2003 | 27.1% | 22.4% | +4.7 |
| 2005 | 27.3% | 20.2% | +7.1 |
| 2007 | 23.3% | 19.7% | +3.6 |
| 2009 | 32.0% | 20.8% | +11.2 |
| 2011 | 28.8% | 23.1% | +5.7 |
| 2013 | 30.2% | 23.4% | +6.8 |
| 2015 | 28.2% | 21.7% | +6.5 |
| 2017 | 25.9% | 19.8% | +6.1 |
| 2019 | – | 21.7% | – |
Recent Data
- 2019: 25% of high school students use marijuana (one in four)
- 2024: 25% of high school students use marijuana and occassionally engage in THC detox
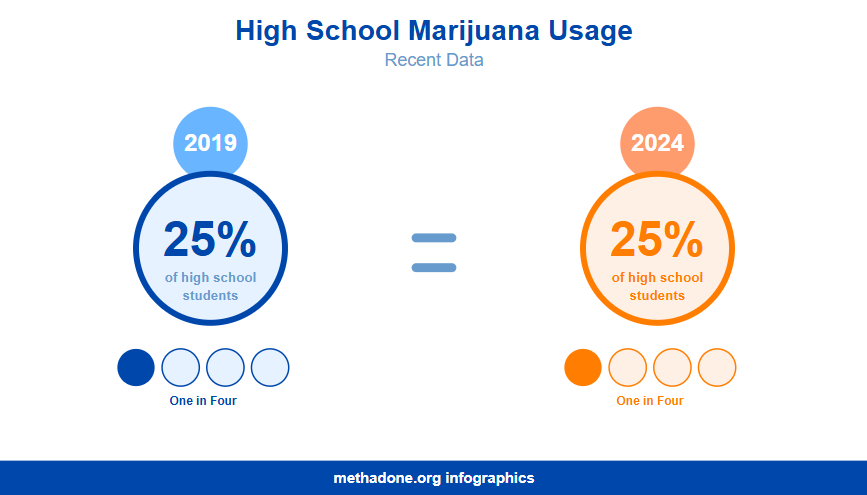
Current marijuana use among Guam high school students consistently exceeded US rates, particularly notable in 2009 when the gap reached 11.2 percentage points. Some of them use special detox shampoos to pass drug tests.
Current Marijuana Use by Sex (High School)
| Year | Male (%) | Female (%) | Gender Gap |
| 1999 | 31.8% | 19.6% | 12.2 |
| 2001 | 33.3% | 19.5% | 13.8 |
| 2003 | 31.4% | 22.8% | 8.6 |
| 2005 | 32.6% | 23.0% | 9.6 |
| 2007 | 25.6% | 20.5% | 5.1 |
| 2009 | 38.1% | 25.6% | 12.5 |
| 2011 | 31.0% | 26.5% | 4.5 |
| 2013 | 33.1% | 26.9% | 6.2 |
| 2015 | 30.4% | 26.5% | 3.9 |
| 2017 | 28.0% | 23.9% | 4.1 |
Male students consistently reported higher marijuana use than females.
Current Marijuana Use by Ethnicity (High School)
| Year | Chamorro (%) | Filipino (%) | Other Micronesian (%) |
| 1999 | 34.7% | 16.0% | – |
| 2001 | 33.7% | 14.5% | – |
| 2003 | 40.1% | 9.6% | 25.3% |
| 2005 | 37.0% | 12.0% | 12.5% |
| 2007 | 35.8% | 8.0% | 22.4% |
| 2009 | 44.2% | 13.2% | 17.0% |
| 2011 | 35.8% | 14.1% | 23.8% |
| 2013 | 41.5% | 13.1% | 20.4% |
| 2015 | 39.4% | 8.2% | 26.8% |
| 2017 | 32.8% | 7.1% | 29.9% |
| 2019 | – | – | 33.7% |
Stark ethnic disparities persisted throughout the period.
Age at First Marijuana Use (High School)
| Year | Total (%) | Male (%) | Female (%) | Gender Gap |
| 1999 | 13.4% | 19.1% | 8.5% | 10.6 |
| 2001 | 15.5% | 22.9% | 7.8% | 15.1 |
| 2003 | 14.9% | 19.7% | 9.9% | 9.8 |
| 2005 | 14.8% | 19.7% | 10.5% | 9.2 |
| 2007 | 15.4% | 20.2% | 9.9% | 10.3 |
| 2009 | 14.3% | 19.0% | 9.2% | 9.8 |
| 2011 | 15.1% | 19.3% | 10.4% | 8.9 |
| 2013 | 14.6% | 17.6% | 11.1% | 6.5 |
| 2015 | 12.8% | 17.6% | 8.9% | 8.7 |
| 2017 | 14.5% | 17.0% | 11.3% | 5.7 |
Approximately 13-15% of high school students initiated marijuana use before age 13.
Middle School Students – Marijuana Use
Lifetime Marijuana Use
- 2003: 11.9%
- 2005: 13.9%
- 2007: 20.6%
- 2009: 14.9%
- 2011: 12.6%
- 2013: 17.6%
- 2015: 12.7%
- 2017: 18.9%
- 2019: 20.2%
- 2020: 20.5%
One in five middle school students (20.5%) had tried marijuana by 2020. Some of them later engaged in THC detox.
Lifetime Marijuana Use by Sex (Middle School)
| Year | Male (%) | Female (%) | Gender Gap |
| 1999 | 15.4% | 9.6% | 5.8 |
| 2001 | 18.4% | 9.7% | 8.7 |
| 2003 | 24.9% | 17.1% | 7.8 |
| 2005 | 20.0% | 9.8% | 10.2 |
| 2007 | 15.2% | 9.8% | 5.4 |
| 2009 | 22.5% | 12.1% | 10.4 |
| 2011 | 17.1% | 12.7% | 4.4 |
| 2013 | 22.4% | 15.4% | 7.0 |
| 2015 | 24.2% | 16.8% | 7.4 |
| 2017 | 21.6% | 19.3% | 2.3 |
Age at First Marijuana Use (Middle School, 2019)
- 5.1% tried marijuana before age 11
One in twenty middle school students initiated marijuana use in elementary school.
Youth Methamphetamine Use
Lifetime Methamphetamine Use (High School)
| Year | Guam HS (%) | US HS (%) | Difference |
| 1999 | 12.9% | 9.1% | +3.8 |
| 2001 | 9.6% | 9.8% | -0.2 |
| 2003 | 6.4% | 7.6% | -1.2 |
| 2005 | 5.6% | 6.2% | -0.6 |
| 2007 | 5.9% | 4.4% | +1.5 |
| 2009 | 3.2% | 4.1% | -0.9 |
| 2011 | 4.6% | 3.8% | +0.8 |
| 2013 | 4.5% | 3.2% | +1.3 |
| 2015 | 5.0% | 3.0% | +2.0 |
| 2017 | 5.6% | 2.5% | +3.1 |
| 2019 | – | 2.1% | – |
Recent Data
- 2019: 5.6% of high school students reported ever using methamphetamines
- 2024: ~6% of high school students tried methamphetamines
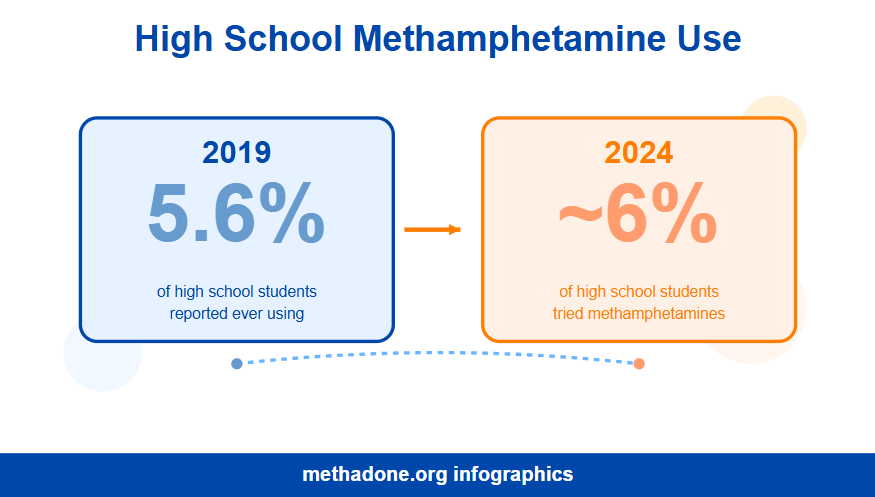
After declining from 12.9% (1999) to 3.2% (2009), methamphetamine use among Guam high schoolers stabilized around 5-6%.
Lifetime Methamphetamine Use by Sex (High School)
| Year | Male (%) | Female (%) | Gender Gap | Higher Gender |
| 1999 | 12.3% | 13.5% | 1.2 | Female |
| 2001 | 12.0% | 7.0% | 5.0 | Male |
| 2003 | 7.2% | 5.5% | 1.7 | Male |
| 2005 | 3.4% | 8.0% | 4.6 | Female |
| 2007 | 7.5% | 3.7% | 3.8 | Male |
| 2009 | 4.0% | 2.3% | 1.7 | Male |
| 2011 | 5.3% | 3.5% | 1.8 | Male |
| 2013 | 5.8% | 3.1% | 2.7 | Male |
| 2015 | 7.5% | 2.4% | 5.1 | Male |
| 2017 | 7.7% | 2.8% | 4.9 | Male |
Gender patterns fluctuated in early years but stabilized with males showing higher use by 2007-2017.
Lifetime Methamphetamine Use by Ethnicity (High School)
| Year | Chamorro (%) | Filipino (%) | Other Micronesian (%) |
| 1999 | 17.7% | 6.5% | – |
| 2001 | 10.2% | 6.5% | – |
| 2003 | 8.0% | 3.7% | 7.1% |
| 2005 | 7.2% | 3.7% | 2.2% |
| 2007 | 5.7% | 2.5% | 6.4% |
| 2009 | 4.1% | 1.4% | 6.4% |
| 2011 | 4.5% | 2.2% | 1.6% |
| 2013 | 6.6% | 1.4% | 3.1% |
| 2015 | 6.7% | 1.6% | 5.9% |
| 2017 | 5.8% | 2.9% | 3.6% |
| 2019 | – | – | 8.2% |
Chamorro students consistently reported the highest methamphetamine use rates.
Youth Prescription Drug Misuse
Prescription Pain Medication Misuse (2017-2019)
- 2017: 10.9% of high school students
- 2019: 15.5% of high school students (higher than US rate of 14.3%)
- 2019: 6.7% of middle school students
By Sex (High School, 2019)
- Males: 18.4%
- Females: 12.3%
- Gender gap: 6.1 percentage points
By Sex (Middle School, 2019)
- Males: 6.9%
- Females: 6.3%
- Gender gap: 0.6 percentage points
By Ethnicity (2019)
| School Level | Chamorro (%) | Filipino (%) | Other Micronesian (%) |
| Middle School | 5.7% | 6.0% | 8.0% |
| High School | 15.5% | 12.1% | 21.4% |
Prescription pain medication misuse increased 42% among high school students between 2017-2019.
Other Illicit Drug Use Among Youth (High School, 2019)
| Drug Type | USA (%) | Guam (%) | Difference |
| Synthetic Marijuana | 7.3% | 13.5% | +6.2 |
| Cocaine | 3.9% | 5.2% | +1.3 |
| Heroin | 1.8% | 4.0% | +2.2 |
| Steroids | 1.9% | 4.0% | +2.1 |
| Ecstasy | 3.6% | 3.6% | 0.0 |
| Injecting Drug Use | 1.6% | 3.2% | +1.6 |
Guam youth exceeded US rates for nearly all illicit drugs surveyed.
Drug Exposure on School Property
Offered, Sold, or Given Illegal Drugs on School Property (High School)
| Year | Guam HS (%) | US HS (%) | Guam-US Gap |
| 1999 | 46.7% | 30.2% | +16.5 |
| 2001 | 36.1% | 28.5% | +7.6 |
| 2003 | 44.1% | 28.7% | +15.4 |
| 2005 | 41.1% | 25.4% | +15.7 |
| 2007 | 36.8% | 22.3% | +14.5 |
| 2009 | 39.0% | 22.7% | +16.3 |
| 2011 | 40.9% | 25.6% | +15.3 |
| 2013 | 37.2% | 22.1% | +15.1 |
| 2015 | 40.1% | 21.7% | +18.4 |
| 2017 | 36.2% | 19.8% | +16.4 |
| 2019 | – | 21.8% | – |
Recent Data
- 2013: More than 40% of high school youth
- 2014: More than 40% of high school youth
- 2019: 36% of high school youth
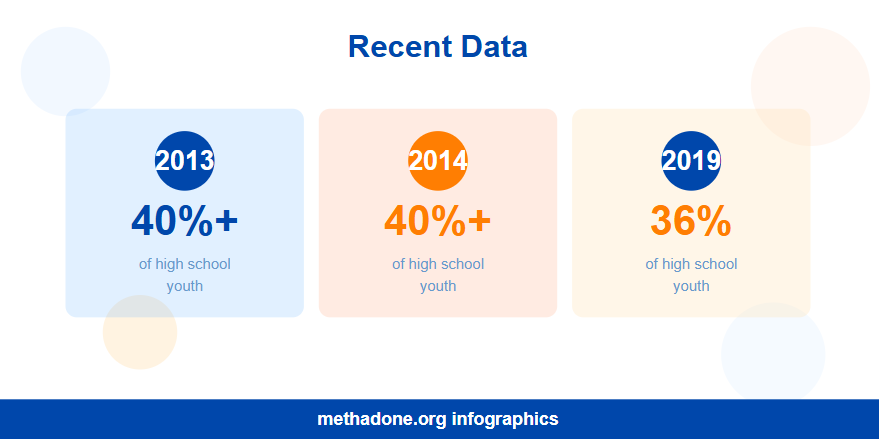
School campuses remained critical drug distribution points.
By Sex (High School)
| Year | Male (%) | Female (%) | Gender Gap |
| 1999 | 56.0% | 38.5% | 17.5 |
| 2001 | 42.5% | 29.3% | 13.2 |
| 2003 | 47.1% | 41.0% | 6.1 |
| 2005 | 44.0% | 39.1% | 4.9 |
| 2007 | 42.0% | 30.7% | 11.3 |
| 2009 | 44.0% | 33.5% | 10.5 |
| 2011 | 42.7% | 38.6% | 4.1 |
| 2013 | 37.0% | 37.4% | -0.4 |
The gender gap in drug exposure on school property narrowed dramatically.
Adult Substance Use Statistics
Marijuana Use Among Adults
Current Use Trends (Past 30 Days)
- 2011: 17.0%
- 2012: 13.0%
- 2013: 13.0%
- 2016: 12.0%
- 2018: 6.3%
- 2019: 11.7%
- 2020: 8.4%
- 2021: 12.6%
Adult marijuana use fluctuated considerably, ranging from 6.3% to 17% over the decade, with no clear linear trend.
Daily Marijuana Use (2016)
- 3.7% of adults reported daily marijuana use
Nearly 1 in 27 adults used marijuana every day, indicating a significant population with potential dependency. Some of them also regularly resort to THC detox for various job-related reasons.
Demographics of Marijuana Use (2021)
| Demographic | Prevalence (%) |
| Sex | |
| Adult men | 16.5% |
| Adult women | 8.3% |
| Age | |
| 18-24 years | Highest among adults |
| 25-34 years | 17.6% |
| Education | |
| High school or GED | 13.3% |
| Income | |
| Below $25,000 | Highest rates |
| Ethnicity | |
| Other | 27.4% |
| Asian | 19.8% |
| Filipino | 16.1% |
| White/Caucasian | 11.9% |
| Micronesian | 2.7% |
Men were twice as likely as women to use marijuana.
Age at First Marijuana Use (2020)
- 23% of lifetime users first used before age 17
- 12.3% first used between ages 18-24
- Nearly 60% of lifetime users (2012 data) started between ages 13-17
Lifetime Marijuana Use (2012-2013)
32% of adults reported ever using marijuana
Perceived Risk of Marijuana Use Among Adults
| Year | No Risk (%) | Slight Risk (%) | Moderate Risk (%) | Great Risk (%) |
| 2011 | 10.5% | 14.6% | 24.6% | 49.7% |
| 2012 | 12.9% | 13.6% | 23.8% | 49.4% |
| 2013 | 17.3% | 14.4% | 23.7% | 44.1% |
| 2016 | 25.3% | 17.6% | 18.4% | 28.2% |
| 2018 | 29.0% | 19.3% | 18.0% | 21.9% |
| 2019 | 29.1% | 18.6% | 19.2% | 17.8% |
| 2020 | 32.1% | 20.5% | 15.9% | 20.7% |
Risk perception declined dramatically over the decade.
Other Illicit Drug Use Among Adults
Illicit Drug Use (Other Than Marijuana)
| Year | Illicit Drug Use (%) | Illicit Prescription Drug Use (%) | Narcotic Pain Reliever Use (%) |
| 2017 | 5.7% | 4.9% | 3.0% |
| 2018 | 17.0% | 2.8% | 3.5% |
| 2019 | 5.4% | 2.2% | 2.6% |
| 2020 | 15.5% | 1.8% | 2.6% |
| 2021 | 10.2% | 1.6% | – |
Illicit drug use showed high volatility, with spikes in 2018 (17.0%) and 2020 (15.5%).
Recent Statistics (2024)
- 3.5% of adults misuse prescription drugs
- 10.4% use illicit drugs other than marijuana
- 15% smoke daily
- 11.1% use e-cigarettes (highest rate in the nation)
Guam leads the nation in e-cigarette use at more than double typical state rates.
Methamphetamine Use (2012-2013)
- 5% of adults reported lifetime methamphetamine use
- Males reported higher rates than females
- Lower educational attainment and lower income associated with use
- Highest lifetime use among those aged 25-34
- Over 40% of lifetime users started between ages 18-24
Methamphetamine use disproportionately affected economically disadvantaged populations.
Other Illicit Drugs (2012-2013)
- 4.4% of adults reported lifetime use of other illicit drugs
- Males more likely to report use than females
- Higher educational attainment and income associated with use
- Highest percentage among those aged 45-54
- Over 50% started between ages 18-24
- 34.2% started between ages 13-17
Unlike methamphetamine, other illicit drug use correlated with higher socioeconomic status and peaked among older adults.
Prescription Drug Risk Perception (2020)
- 63.7% believed great risk in using prescription drugs improperly
- 7.4% believed no risk
- 13.5% of Micronesians perceived no risk
- 8% of Filipinos perceived no risk
- 6.8% of other Asians perceived no risk
- 6.3% of CHamorus perceived no risk
- 2.3% of Caucasians perceived no risk
Significant ethnic disparities in risk perception existed, with Micronesians nearly six times more likely than Caucasians to perceive no risk from prescription drug misuse.
Age at First Illicit Drug Use (2020, 2013)
- 3.6% of adults who used illicit drugs started before age 18 (2020)
- 43% started between ages 13-17 (2013)
- 43% started between ages 18-24 (2013)
The vast majority (86%) of illicit drug users initiated use before age 25.
Workplace Drug Testing (2013, 2020)
- 51% of adults worked for employers conducting random drug testing (2013)
- 38.5% worked for such employers (2020)
- 10% less likely to work for such employers (2013)
- 13.2% less likely (2020)
The proportion of employees subject to workplace drug testing declined 25% between 2013-2020.
Treatment Facility Statistics
2010 N-SSATS Data
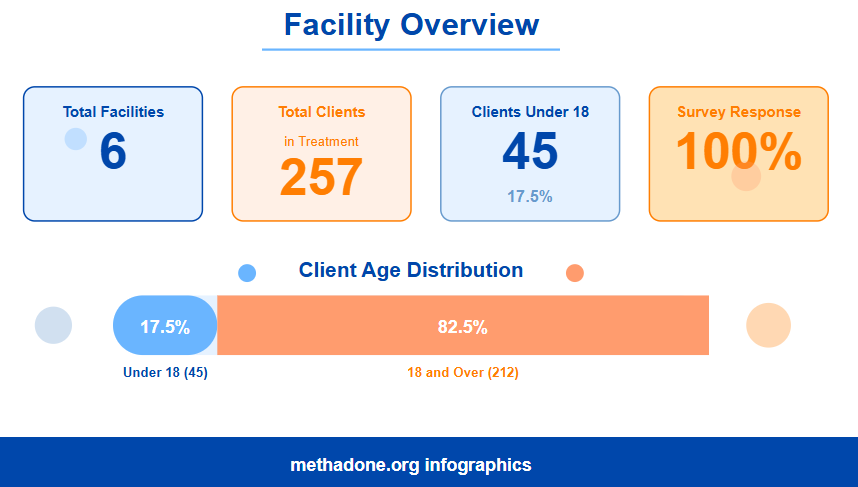
Facility Overview
- Total facilities: 6
- Total clients in treatment: 257
- Clients under 18: 45 (17.5% of total)
- Survey response rate: 100%
Facility Operation by Type
| Operation Type | Facilities | % | All Clients | % | Clients Under 18 | % |
| Private non-profit | 5 | 83.3% | 67 | 26.1% | 1 | 2.2% |
| State government | 1 | 16.7% | 190 | 73.9% | 44 | 97.8% |
| Private for-profit | 0 | 0% | 0 | 0% | 0 | 0% |
| Local/county/community government | 0 | 0% | 0 | 0% | 0 | 0% |
State government facilities served nearly three-quarters of all clients and the vast majority of youth clients. Some prefer to detox at home.
Type of Care Provided (2010)
| Care Type | Facilities | % | All Clients | % | Clients Under 18 | % |
| Outpatient | 5 | 83.3% | 167 | 65.0% | 38 | 84.4% |
| Regular outpatient | 5 | 83.3% | 102 | 39.7% | – | – |
| Intensive outpatient | 5 | 83.3% | 59 | 23.0% | – | – |
| Residential (non-hospital) | 4 | 66.7% | 78 | 30.4% | 7 | 15.6% |
| Short term residential | 4 | 66.7% | 33 | 12.8% | – | – |
| Long term residential | 4 | 66.7% | 38 | 14.8% | – | – |
| Hospital Inpatient | 1 | 16.7% | 12 | 4.7% | 0 | 0% |
Outpatient care dominated treatment delivery, serving two-thirds of all clients.
Substance Abuse Problems Treated (2010)
| Problem Type | All Clients | % |
| Alcohol abuse only | 126 | 49.0% |
| Drug abuse only | 104 | 40.5% |
| Both alcohol and drug abuse | 27 | 10.5% |
Alcohol remained the single most common substance of abuse, though drug-only cases comprised a substantial proportion.
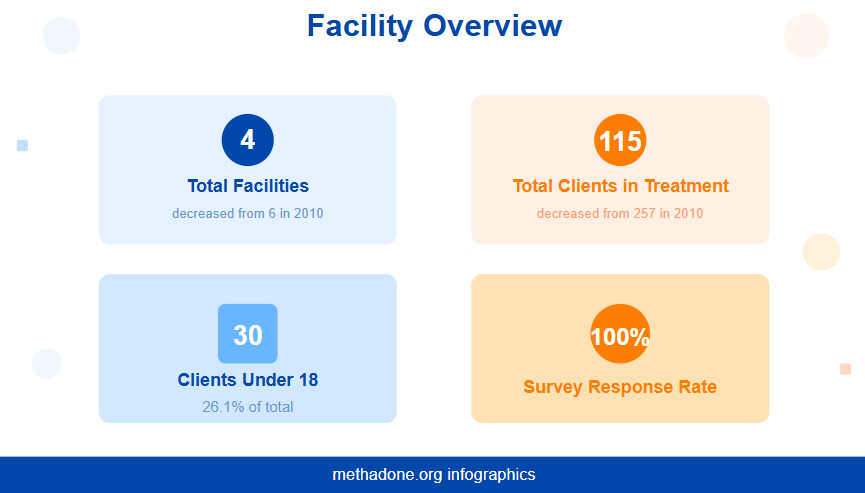
2012 N-SSATS Data
Facility Overview
- Total facilities: 4 (decreased from 6 in 2010)
- Total clients in treatment: 115 (decreased from 257 in 2010)
- Clients under 18: 30 (26.1% of total)
- Survey response rate: 100%
Facility Operation by Type (2012)
| Operation Type | Facilities | % | All Clients | % | Clients Under 18 | % |
| Private non-profit | 3 | 75.0% | 83 | 72.2% | 30 | 100% |
| Private for-profit | 1 | 25.0% | 32 | 27.8% | 0 | 0% |
| Government (all types) | 0 | 0% | 0 | 0% | 0 | 0% |
Between 2010 and 2012, treatment facilities decreased by one-third, and total clients in treatment dropped by 55%.
Substance Abuse Problems Treated (2012)
| Problem Type | All Clients | % |
| Both alcohol and drug abuse | 81 | 70.4% |
| Drug abuse only | 20 | 17.4% |
| Alcohol abuse only | 14 | 12.2% |
By 2012, the pattern reversed dramatically from 2010, with co-occurring alcohol and drug abuse becoming the dominant problem type (70.4% vs. 10.5% in 2010).
Residential Facility Capacity and Utilization (2012)
- Number of residential facilities: 3
- Number of clients: 35
- Number of designated beds: 42
- Utilization rate: 83.3%
- Average beds per facility: 14
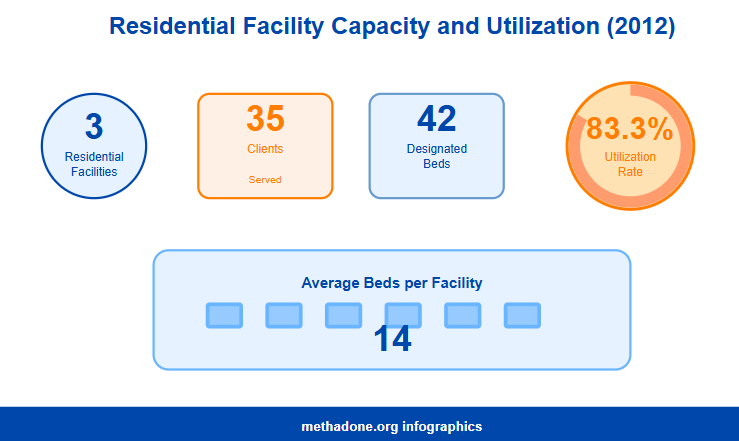
High utilization rates (83.3%) indicated strong demand for residential treatment services.
Law Enforcement and Drug Seizures
Drug-Related Arrests
| Year | Number of Cases | % Change from Previous Year | Rate per 1,000 Population |
| 2010 | 130 | -17.2% | 1.0 |
| 2011 | 221 | +70.0% | 1.4 |
| 2012 | 293 | +32.6% | 1.8 |
| 2013 | 271 | -7.5% | 1.7 |
| 2014 | 369 | +36.2% | 2.3 |
| 2015 | 477 | +29.3% | 3.0 |
| 2016 | 494 | +3.5% | 3.0 |
| 2017 | 230 | -53.4% | 1.5 |
| 2018 | 421 | +83.0% | 2.6 |
| 2019 | 494 | +17.3% | 3.0 |
| 2020 | 802 | +62.3% | 4.9 |
| 2021 | 880 | +9.7% | 5.2 |
Drug-related arrests more than tripled from 2017 (230 cases) to 2021 (880 cases).
2021 Arrest Details
- 76% of drug offenders arrested for possession of illegal substances
- Majority of arrests involved possession rather than distribution
Youth in Drug Arrests (2014)
Nearly half (46%) of persons arrested for drug abuse violations were under age 18
Superior Court Drug Cases (Fiscal Years)
- FY 2014: 176 cases
- FY 2015: 229 cases (+30.1%)
- FY 2016: 261 cases (+14.0%)
- Represents 47% increase from FY 2014 to FY 2016
- Primarily involved Schedule II controlled substances (methamphetamine)
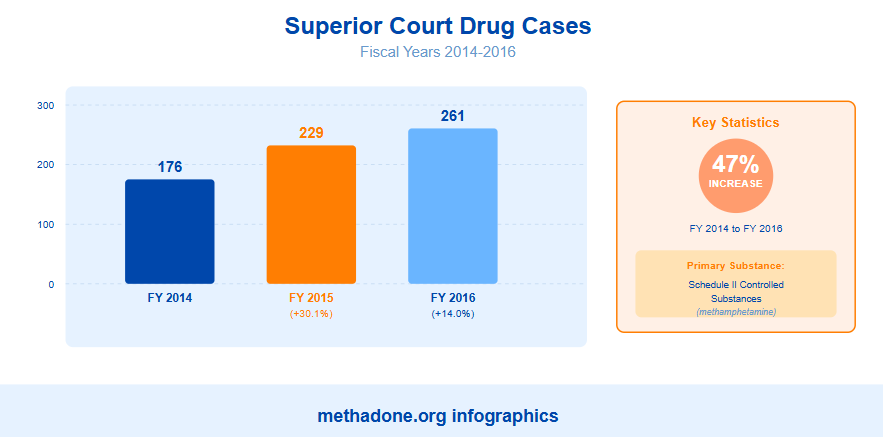
The steady 47% increase in drug cases over three years strained judicial system capacity and foreshadowed the more dramatic arrest increases seen in 2018-2021.
Drug Seizures by Type
| Year | Cannabis (g) | Methamphetamines (g) | Total (g) | Dominant Drug |
| 2013 | 1,739 | 19,023 | 20,762 | Meth |
| 2014 | 3,041 | 6,833 | 9,874 | Meth |
| 2015 | 8,873 | 28,082 | 36,955 | Meth |
| 2016 | 8,073 | 58,442 | 66,515 | Meth |
| 2017 | 727 | 9,733 | 10,460 | Meth |
| 2018 | 15,249 | 14,159 | 29,408 | Cannabis |
| 2019 | 24,486 | 3,173 | 27,659 | Cannabis |
| 2020 | 11,207 | 36,336 | 47,543 | Meth |
| 2021 | 88,016 | 75,839 | 163,855 | Cannabis |
Drug seizures showed extreme volatility.
2024 Seizure Data
- Approximately 31,000 grams of methamphetamine seized
- Street value: $3 million
The substantial seizure demonstrates continued high-volume methamphetamine trafficking into Guam.
Law Enforcement Resources
Police Staffing
- 2.3 officers per 1,000 residents (Guam)
- 3.4 officers per 1,000 residents (US national average)
- Guam staffing 32% below national average
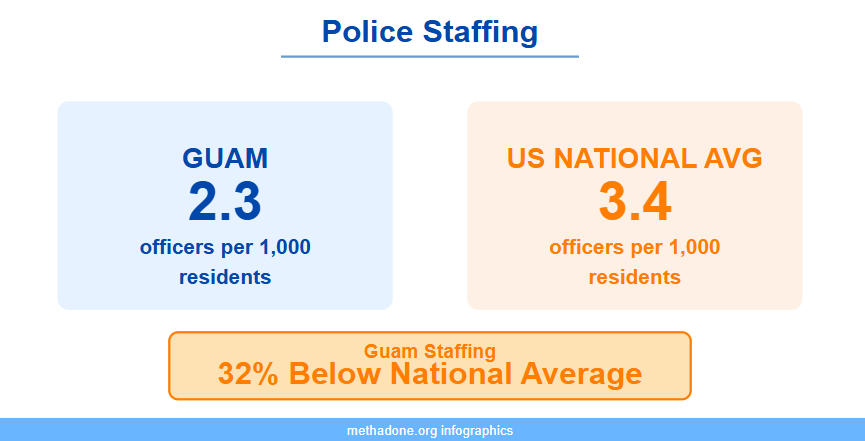
Understaffing of law enforcement likely impacted drug enforcement capabilities during a period of rising drug arrests and seizures.
Guam’s substance abuse crisis demands urgent, comprehensive intervention as the data reveals a perfect storm of persistently high youth drug use rates, stark ethnic disparities, methamphetamine deaths surging to become the third leading cause of death by 2023, school campuses functioning as entrenched drug marketplaces, treatment infrastructure contracting precisely when polysubstance abuse patterns intensified, and law enforcement resources stretched 32% below national staffing levels even as drug-related arrests nearly quadrupled and seizures reached record levels—all indicators pointing to an escalating multi-generational public health emergency requiring immediate expansion of culturally-targeted prevention programs, treatment capacity, and coordinated Supply-and-demand reduction strategies.
Statistical Data on Alcohol in Guam
Guam demonstrates lower overall alcohol consumption rates compared to national averages, yet faces elevated binge drinking among adults and persistent youth drinking challenges despite significant policy interventions. This comprehensive statistical overview examines alcohol use patterns across Guam’s population, revealing the impact of key policy changes. The data encompasses consumption behaviors across age groups, sex, and ethnicity, risk behaviors including drinking and driving, health consequences particularly related to alcohol-associated cancers, and law enforcement outcomes.
Youth Alcohol Consumption
Current Alcohol Use Among High School Students
Guam vs. United States (1995-2019)
| Year | Guam HS (%) | US HS (%) |
| 1995 | 34.1 | 51.6 |
| 1997 | 42.0 | 50.8 |
| 1999 | 42.5 | 50.0 |
| 2001 | 44.5 | 47.1 |
| 2003 | 37.9 | 44.9 |
| 2005 | 36.2 | 43.3 |
| 2007 | 34.9 | 44.7 |
| 2009 | 24.7 | 41.8 |
| 2011 | 23.5 | 38.7 |
| 2013 | 25.3 | 34.9 |
| 2015 | 18.2 | 32.8 |
| 2017 | 25.3 | 29.8 |
Current alcohol use among Guam youth increased until 2001, then declined significantly following the 2003 tax increase and 2010 drinking age elevation.
By Sex (2019)
- Males: 28.4%
- Females: 21.6%
Males show moderately higher current alcohol use than females.
By Ethnicity (2019)
- Chamorro: 31.2%
- Micronesian: 31.3%
- Filipino: 11.9%
Chamorro and Micronesian youth demonstrate nearly identical and substantially elevated alcohol use rates.
Binge Drinking Among High School Students
Guam vs. United States (1995-2019)
| Year | Guam HS (%) | US HS (%) |
| 1995 | 14.7 | 32.6 |
| 1997 | 22.9 | 33.4 |
| 1999 | 21.1 | 31.5 |
| 2001 | 24.9 | 29.9 |
| 2003 | 17.3 | 28.3 |
| 2005 | 18.5 | 25.5 |
| 2007 | 19.2 | 26.0 |
| 2009 | 13.6 | 24.2 |
| 2011 | 12.7 | 21.9 |
| 2013 | 13.3 | 20.8 |
| 2015 | 7.9 | 17.7 |
| 2017 | 8.2 | 13.5 |
Youth binge drinking in Guam increased from 1995-2001, then declined substantially following policy interventions.
By Sex (2019)
- Males: 7.9%
- Females: 8.6%
Female youth show slightly higher binge drinking rates than males.
By Ethnicity (2019)
- Micronesian: 13.7%
- Chamorro: 8.7%
- Filipino: 3.4%
There exists significant ethnic disparities in high-risk drinking behaviors among young people.
High-Risk Out-of-School Youth (2011)
Alcohol Use Comparison: DYA vs. Sanctuary, Inc. vs. Public School Students
| Indicator | DYA (%) | Sanctuary, Inc. (%) | Public School (%) |
| Lifetime use | 42.3 | 57.5 | 58.4 |
| Current use | 26.8 | 28.8 | 24.2 |
| First use before age 13 | 13.0 | 13.8 | 18.2 |
| Binge drinking | 20.5 | 18.8 | 13.6 |
| Riding with drinking driver | 22.1 | 20.0 | 30.2 |
| Drinking and driving | 8.6 | 2.5 | 5.8 |
| Parent discussions | 48.9 | 53.8 | 42.2 |
Out-of-school high-risk youth showed higher binge drinking rates than public school students.
Adult Alcohol Consumption Patterns
Guam vs. United States Comparison (2011-2021)
| Year | Guam (%) | USA (%) |
| 2011 | 41.8 | 57.0 |
| 2012 | 40.9 | 55.1 |
| 2013 | 40.9 | 54.4 |
| 2014 | 46.6 | 53.1 |
| 2015 | 43.5 | 53.6 |
| 2016 | 42.2 | 54.0 |
| 2017 | 43.7 | 54.7 |
| 2018 | 41.0 | 53.5 |
| 2019 | 41.6 | 53.8 |
| 2020 | 41.4 | 52.4 |
| 2021 | 39.8 | 53.2 |
Current alcohol use in Guam consistently remained lower than US national rates throughout the decade.
Sex Differences in Adult Drinking (2021)
- Current use: 43.9% of males compared to 35.4% of females
- Binge drinking: 21.7% of males compared to 12.1% of females
- Heavy drinking: 6.4% of males compared to 4.6% of females
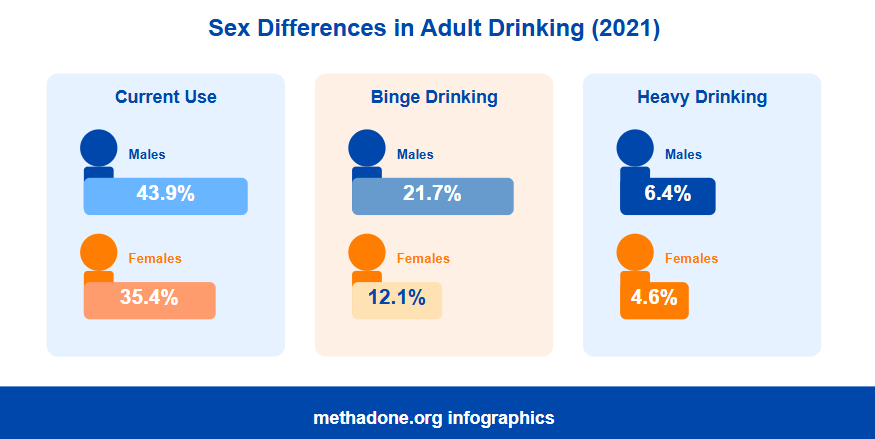
Males demonstrated consistently higher rates across all drinking patterns.
Heavy Drinking Trends
Guam vs. United States (2011-2021)
| Year | Guam (%) | USA (%) |
| 2011 | 6.8 | 6.6 |
| 2012 | 7.5 | 6.1 |
| 2013 | 7.0 | 6.2 |
| 2014 | 8.7 | 5.9 |
| 2015 | 8.1 | 5.9 |
| 2016 | 8.3 | 6.5 |
| 2017 | 7.8 | 6.3 |
| 2018 | 7.4 | 6.5 |
| 2019 | 9.0 | 6.5 |
| 2020 | 6.7 | 6.7 |
| 2021 | 5.5 | 6.2 |
Heavy drinking rates in Guam fluctuated more than US rates but converged by 2021, with Guam slightly below the national average at 5.5% compared to 6.2%.
Binge Drinking Among Adults
Guam vs. United States (2011-2021)
| Year | Guam (%) | USA (%) |
| 2011 | 18.3 | 18.3 |
| 2012 | 19.4 | 16.9 |
| 2013 | 20.9 | 16.8 |
| 2014 | 23.0 | 16.0 |
| 2015 | 21.2 | 16.3 |
| 2016 | 20.7 | 16.9 |
| 2017 | 22.7 | 17.4 |
| 2018 | 17.9 | 16.2 |
| 2019 | 18.0 | 16.8 |
| 2020 | 16.2 | 15.7 |
| 2021 | 17.1 | 15.3 |
Binge drinking rates in Guam surpassed US levels throughout most of the decade.
Binge Drinking by Age Group (2021)
- 18-24 years: 21.2%
- 25-34 years: 17.0%
- 35-44 years: 26.6%
- 45-54 years: 17.0%
- 55-64 years: 5.8%
Binge drinking peaks among adults aged 35-44 and declines sharply after age 55
Binge Drinking by Ethnicity
- Whites/Caucasians: 25.0%
- Micronesians: 22.5%
- Chamorros: 17.0%
- Other Asians: 15.2%
- Filipinos: 8.5%
Ethnic disparities in binge drinking are substantial
Age at First Alcohol Use
- Before age 12: 4%
- Ages 13-17: 32%
- Ages 18-24: 51%
- Age 17 or younger: 34.8%
Over one-third of Guam adults first consumed alcohol before the legal age of 21.
Risk Behaviors and Consequences
Drinking and Driving Among High School Students
Guam (1995-2019) – Males vs. Females
| Year | Males (%) | Females (%) |
| 1995 | 13.2 | 4.4 |
| 2001 | 16.4 | 6.4 |
| 2005 | 14.6 | 5.4 |
| 2009 | 6.0 | 5.6 |
| 2011 | 12.1 | 6.0 |
| 2013 | 10.2 | 6.8 |
| 2015 | 6.8 | 4.1 |
| 2017 | 12.5 | 2.1 |
Males consistently showed higher rates of drinking and driving.
Health Consequences: Cancer
Top Cancer Deaths Related to Alcohol (2013-2017)
| Rank | Cancer Site | Deaths | % of Total |
| 2 | Colon-Rectum-Anus | 82 | 10.2% |
| 3 | Liver | 79 | 9.8% |
| 4 | Breast | 69 | 8.6% |
| 7 | Mouth and Pharynx | 24 | 3.0% |
Liver cancer, directly related to alcohol use, rose from the 5th leading cause of cancer death (2003-2007) to 3rd place (2013-2017).
Alcohol-Related Arrests
Adult Population (2016-2021)
| Year | DUI Arrests | Liquor Laws | Drunkenness | % of Total Arrests |
| 2016 | 145 | 80 | 7 | 5.9% |
| 2017 | 122 | 52 | 12 | 5.0% |
| 2018 | 96 | 129 | 159 | 9.8% |
| 2019 | 269 | 228 | 308 | 10.1% |
| 2020 | 293 | 81 | 187 | 8.1% |
| 2021 | 461 | 51 | 161 | 6.8% |
DUI Arrest Trends
- 2016: 140 arrests (0.9 per 1,000 population)
- 2018: 348 arrests (2.1 per 1,000) – 178.4% increase
- 2019: 350 arrests (2.1 per 1,000)
- 2021: 358 arrests (2.1 per 1,000)
Juvenile Arrests (2016-2021)
| Year | Total Arrests | DUI | Liquor Laws | Drunkenness | % Alcohol-Related |
| 2016 | 410 | 1 | 46 | 1 | 11.7% |
| 2017 | 337 | 5 | 122 | 0 | 35.1% |
| 2018 | 317 | 1 | 34 | 11 | 14.5% |
| 2019 | 1,241 | 5 | 148 | 50 | 16.4% |
| 2020 | 1,026 | 0 | 70 | 27 | 9.4% |
| 2021 | 436 | 1 | 22 | 43 | 15.1% |
Alcohol-related arrests comprised 8.1% of all cleared arrests in 2020 and 6.8% in 2021. Juvenile alcohol-related arrests showed significant volatility, peaking at 35.1% in 2017.
Traffic Fatalities
- 2011: 27.3% of traffic fatalities involved alcohol (6 of 22 deaths)
- 2013: 44% of traffic-related deaths involved alcohol
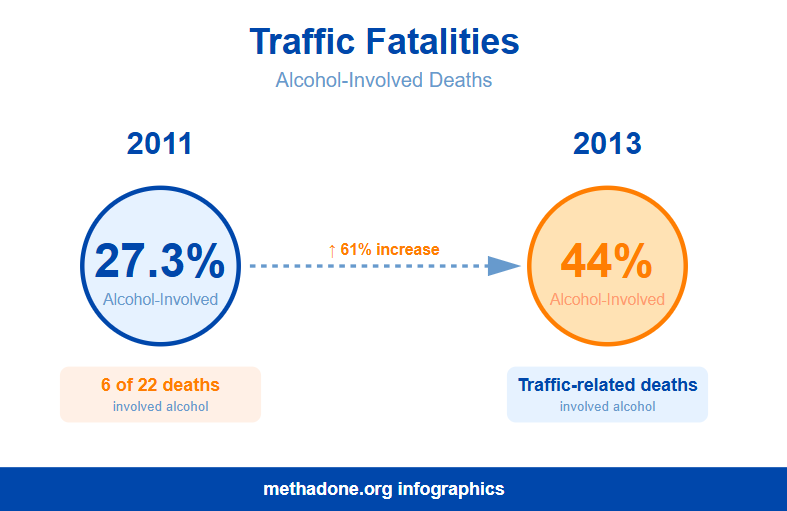
Alcohol remained a significant factor in traffic fatalities.
Guam’s alcohol consumption data reveals a complex public health landscape characterized by successful policy interventions that reduced youth drinking rates, yet persistent challenges remain with adult binge drinking rates exceeding national averages and significant ethnic disparities across all age groups. The dramatic rise of liver cancer from the 5th to 3rd leading cause of cancer death, coupled with alcohol’s involvement in over one-quarter of traffic fatalities and fluctuating arrest patterns, underscores the ongoing need for sustained prevention efforts, particularly targeting high-risk populations including Micronesian and Chamorro communities, young adults aged 35-44, and males who consistently demonstrate the highest consumption rates across all drinking behaviors.
Conclusion
In general, Guam faces a severe dual substance abuse crisis characterized by persistently high youth marijuana and methamphetamine use rates that consistently exceed national averages, with school campuses serving as primary drug distribution points where over one-third of students are offered illegal substances. Many people there also use various THC detox kits. While alcohol policy interventions successfully reduced youth drinking after 2003 and 2010, adult binge drinking remains elevated, liver cancer has risen to the third leading cause of cancer death, and methamphetamine-related deaths surged 42%. Stark ethnic disparities disproportionately affect Chamorro and Micronesian populations, while treatment infrastructure contracted 55% and law enforcement resources remain 32% below national levels even as drug arrests nearly quadrupled from 2017 to 2021. This escalating multi-generational public health emergency demands immediate expansion of culturally-targeted prevention, treatment capacity, and coordinated intervention strategies addressing Guam’s unique challenges.
Sources:
- 2010 State Profile — Guam National Survey of Substance Abuse Treatment Services (N-SSATS) | SAMHSA
- 2012 State Profile — Guam National Survey of Substance Abuse Treatment Services (N-SSATS) | SAMHSA
- ‘Addiction is a disease’: Guam launches National Drug and Alcohol Facts week | News | guampdn.com
- 2021 Guam State Epidemiological Profile
- III.C. Needs Assessment Update – Guam – 2025
- Report details Guam substance use | Local News | postguam.com
- Guam State Epidemiological Profile
- LETTER: The drug problem on Guam | Opinion | guampdn.com
- (PDF) Guam Substance Abuse and Mental Health Epidemiological Profile, 2014 Update
- Report: Guam drug cases rise by 47% – Justice Speakers International
- Guam Substance Abuse Epidemiological Profile
- Alcohol | Thrive