Statistical Data on Drugs in the District Of Columbia
The District Of Columbia faces one of the most severe substance abuse crises in the United States. It consistently ranks among the worst areas for drug problems, with overdose death rates significantly exceeding national averages. The district’s struggle with substance abuse affects all age groups and communities, with particularly devastating impacts on African American residents and individuals in Wards 5, 7, and 8. This comprehensive statistical overview examines drug use patterns, overdose deaths, treatment access, and the broader public health implications of substance abuse in the District of Columbia.
Drug Overdose Deaths in the District of Columbia
Overall Overdose Statistics
- Annual overdose deaths: 451 deaths per year
- Overdose death rate: 64.3 deaths per 100,000 residents
- Comparison to national rate: 162.71% more than the national overdose death rate; nearly 94% higher in 2023
- Percentage of all deaths: 9.17% of all deaths in the District are from drug overdose
- National ranking: The District ranks 5th nationwide for most severe drug problems and 1st in drug overdose deaths per capita
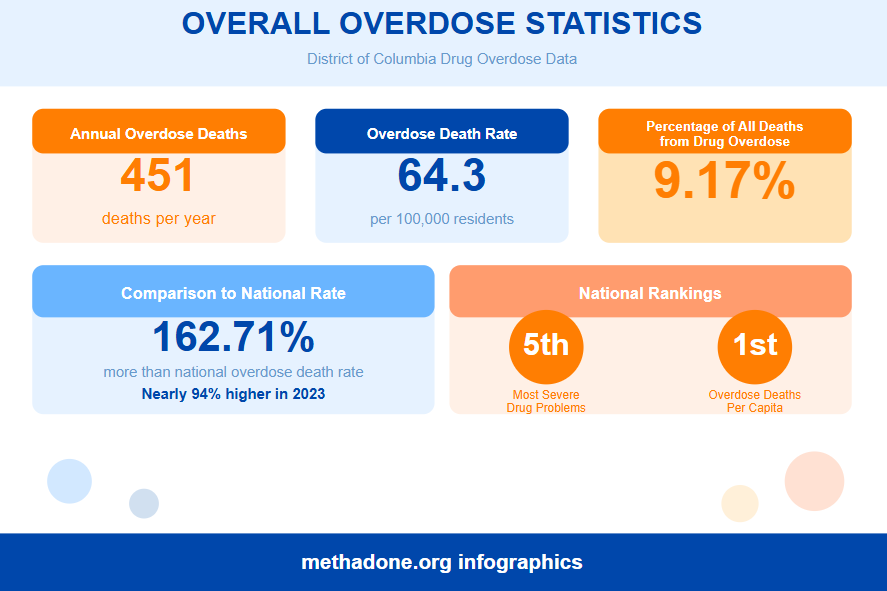
The overdose death rate in the District of Columbia represents a public health emergency of catastrophic proportions.
Opioid-Specific Deaths
Opioid Overdose Statistics
- Opioid overdose deaths in 2023: 350 people
- Percentage of all overdose deaths: 82.0% are opioid-related
- Opioid mortality rate: 49.6 per 100,000 residents
- Comparison to national average: 106.7% higher than the national opioid death rate
- 2018 opioid deaths: 191 D.C. residents died, a death rate of 26 fatalities per 100,000 residents
The fact that opioid-related deaths nearly doubled homicides in 2023 provides stark perspective on the scale of this crisis in the District.
Fentanyl’s Dominance in the District of Columbia
- 98.0% of all opioid overdose deaths involve synthetic opioids like fentanyl
- Approximately 94% of all opioid overdose cases in the District are fentanyl-related
Fentanyl’s potency means District residents face lethal risks even with small dosing errors.
Other Opioid Types
- Heroin involvement: 12.3% of opioid overdose deaths
- Prescription opioid involvement: 6.3% of opioid overdose deaths
- Multiple opioid involvement: Total opioids identified in fatal overdoses in D.C. ranged from 122 (2014) to 537 (2017)

The relatively low percentage of prescription opioid involvement in the District suggests that the current crisis is driven primarily by illicit synthetic opioids rather than prescription medication diversion.
Demographic Patterns of Overdose Deaths in the District of Columbia
Age Distribution in D.C.
- Ages 40-69: Comprise 71% of deadly overdoses
- Historical context: Among overdose victims in D.C., 88% had been using heroin for more than 10 years, 59% for more than 25 years, and 22% for more than 40 years
Overdose deaths disproportionately affect middle-aged and older adults in the District.
Race and Gender in the District of Columbia
- Males: 74% of all overdose deaths in D.C.
- 2014-2019 data: Overall, 957 or 82% of all deaths due to opioid use were among African Americans
There is an overwhelming racial disparity in overdose deaths in the Districts.
Substance Use Prevalence in the District of Columbia
General Drug Use Rates in D.C. (Ages 12+)
- Past-month illicit drug use: 24.91% (144,000 people)
- Past-year marijuana use: 32.61% (188,000 people)
- Past-month marijuana use: 22.43% (129,000 people)
- Past-month illicit drug use (excluding marijuana): 5.53% (32,000 people)
- Past-year cocaine use: 3.35% (19,000 people)
- Past-year hallucinogen use: 7.09% (41,000 people)
- Past-year methamphetamine use: 0.32% (2,000 people)
- Past-year heroin use: 0.57% (3,000 people among adults 18+)
- Past-year prescription pain reliever misuse: 2.27% (13,000 people)
- Past-year opioid misuse: 2.89% (17,000 people)
- Non-medical drug use (past year): 12.1% of adults in the District
Nearly one in four District residents over age 12 used illicit drugs in the past month—more than double the national average. Such data was gathered in part due to hair drug testing
.
Comparison to National Averages for the District
- Illicit drug use: 13.56% past-month use in D.C. vs. 8.82% nationally (earlier data: 12.13% vs. 8.02%)
- Non-marijuana illicit drug use: 4.29% in the District vs. 3.33% nationally (earlier data: 4.53% vs. 3.58%)
- 2017 data: 20.4% of D.C. adults reported past-month illicit drug use vs. 11.2% nationally
- Adolescent comparison (2017): 11.2% of D.C. adolescents vs. 7.8% nationally

District residents report significantly higher rates of drug use than national averages.
Youth and Young Adult Substance Use in the District of Columbia
Adolescents in D.C. (Ages 12-17)
- Past-month drug use: 8.59% (3,000 adolescents)
- Past-year marijuana use: 12.58% (4,000 adolescents)
- Past-year cocaine use: 0.05%
- Past-year methamphetamine use: 0.01%
- Past-year prescription pain reliever use: 1.67%
- Past-month alcohol use: 8.58%
Young people in the District show elevated drug use compared to national peers.
Young Adults in the District (Ages 18-25)
- Past-month drug use: 37.85% (30,000 people)
- Past-year marijuana use: 48.56% (39,000 people)
- Past-month marijuana use: 34.11% (27,000 people)
- Past-month illicit drugs (excluding marijuana): 6.88% (5,000 people)
- Past-year cocaine use: 6.93% (6,000 people)
- Past-year hallucinogen use: 8.47% (7,000 people)
- Past-year opioid misuse: 3.29% (3,000 people)
Young adults in D.C. show the highest rates of substance use. Some of them also detox from marijuana with THC detox kits.
Ward-Specific Data in the District of Columbia
Substance Use Disorder by Ward in D.C. (2002-2004)
| Ward | Illicit Drug Abuse/Dependence (%) |
| Ward 8 | 4.42 |
| Ward 5 | 4.34 |
| Ward 7 | 4.32 |
| Ward 2 | 4.29 |
| Ward 1 | 4.24 |
| Citywide | 4.00 |
| Ward 6 | 3.95 |
| Ward 4 | 3.60 |
| Ward 3 | 3.08 |
AIDS Cases by Ward in the District
- Highest: Ward 1 with 2,752 cumulative cases as of 2004
- Lowest: Ward 3 with 489 cumulative cases
Ward-level disparities in the District reveal how substance abuse concentrates in specific D.C. communities.
Risk Perceptions in the District of Columbia
Marijuana Risk Perception in D.C.
- Perceive great risk from monthly marijuana use: 14.55% of District population (84,000 people)
- Adolescents in D.C. perceiving great risk: 18.52%
- Young adults in D.C. perceiving great risk: 9.03%
- Adult perception in D.C. (ages 12-17, 2019): 36% believe adults in their neighborhood think youth marijuana use is very wrong
- Parental disapproval in the District: 79% believe parents would strongly disapprove of regular use
- Youth risk perception in D.C.: 32% perceive great risk from regular marijuana use
Cocaine and Heroin Risk Perception in the District
- Perceive great risk from monthly cocaine use: 53.72% of District population (310,000 people)
- Perceive great risk from trying heroin once or twice: 76.92% of District population (444,000 people)
The relatively low perception of marijuana risk in the District, particularly among young adults, who believe it’s easy to detox from THC, likely contributes to high usage rates.
Substance Use Disorders in the District of Columbia
Overall Disorder Rates in D.C. (Ages 12+)
- Any substance use disorder: 23.73% (137,000 people)
- Drug use disorder: 13.61% (79,000 people)
- Pain reliever use disorder: 1.53% (9,000 people)
- Opioid use disorder: 2.11% (12,000 people)
A substantial portion of the District’s population meets criteria for substance use disorders.
Youth Substance Use Disorders in the District
- Adolescent substance use disorder (ages 12-17): 9.13% (3,000 adolescents)
- Adolescent drug use disorder: 7.03%
- Adolescent alcohol use disorder: 3.12%
Young Adult Substance Use Disorders in the District
- Substance use disorder (ages 18-25): 37.26% (30,000 people)
- Drug use disorder: 24.22% (19,000 people)
- Marijuana use disorder (2017-2019): 7.0% (6,000 people), similar to national rate of 5.6%
- Illicit drug use disorder (2017-2019): 9.1% (8,000 people), similar to national rate of 7.5%
- Overall substance use disorder (2017-2019): 18.3% (16,000 people), similar to national rate of 14.7%
More than one in three young adults in the District meets criteria for a substance use disorder.
Substance Abuse Treatment in the District of Columbia
Treatment Capacity and Access in D.C.
- Active rehabilitation clinics: 31 facilities
- Annual clients served: 1,827 people
- Outpatient enrollment: 1,671 patients annually
- Residential (non-hospital) enrollment: 156 patients annually
- Historical capacity: Treatment facilities in D.C. decreased from 51 (2002) to 46 (2006)
- Single-day count (March 2019): 1,827 people enrolled in the District, decreased from 2,824 in 2015
- 2010 data: 3,160 individuals went to drug and alcohol treatment in the District
With only 1,827 individuals receiving treatment annually in the District against a backdrop of 137,000 with substance use disorders, the treatment gap is catastrophic.
Treatment Need vs. Access in the District
- Classified as needing treatment: 27.07% of District population (156,000 people)
- Actually receiving treatment: 5.32% of District population (31,000 people)
- Not receiving treatment among those needing it: 79.58% (120,000 people)
- Youth needing treatment (ages 12-17): 12.30% (4,000 adolescents in D.C.)
- Youth not receiving treatment: 75.12%
- Young adults needing treatment (ages 18-25): 37.76% (30,000 people in D.C.)
- Young adults not receiving treatment: 86.20%
Approximately 80% of individuals in the District who need substance abuse treatment are not receiving it. However, some try to detox at home, in particular from THC using special shampoos.
Drug Problems Addressing by Treatment Enrollees
- Drug problem only: 67.6%
- Alcohol problem only: 13.1%
- Both drug and alcohol problems: 19.3%
Primary Substances in Treatment Admissions in D.C. (2010-2011)
- Heroin: 32% of all admissions in the District (1,188 people in 2010)
- Cocaine/crack: 32% of all admissions in D.C. (483 people smoking cocaine, 38 by other means in 2010)
- Marijuana: 509 people dependent in D.C. in 2010
- Gender breakdown for heroin in D.C.: 67.4% male, 32.6% female
- Marijuana treatment gender in D.C.: 79.8% male, 20.2% female
Medication-Assisted Treatment in the District
- Methadone recipients in D.C. (March 2019): 908 people, decreased from 1,315 in 2015
- Buprenorphine recipients in D.C. (March 2019): 128 people, increased from 104 in 2015
The decline in methadone patients in the District alongside a small increase in buprenorphine suggests a modest shift in medication-assisted treatment approaches, though overall MAT capacity in D.C. remains inadequate given the scale of opioid use disorder.
Treatment Costs in the District of Columbia
Residential Treatment Costs in D.C
- Average individual cost: $66,538 per person
- Total public spending: $10.38 million (0.2% of U.S. total)
The District has the highest residential treatment costs in the nation.
Outpatient Treatment Costs in D.C.
- Average individual cost: $1,382 per person
- Total public spending: $2.31 million (0.1% of U.S. total)
- National ranking: D.C. would rank 2nd cheapest for outpatient services if D.C. were a state

Outpatient services in the District are relatively affordable.
Public Health Consequences in the District of Columbia
Infectious Disease in the District
Hepatitis C in the District
- New cases linked to IV drug use (2022): 12.5 per 1,000 residents
- Reported new cases in D.C. (2017): 1,268 total cases
Acute Hepatitis B in the District
- Estimated drug-related cases: 30% of all acute hepatitis B cases in D.C.
- 2004 racial breakdown: Nearly three-quarters were African American; nearly 60% were male
HIV/AIDS in the District
- New HIV/AIDS diagnoses linked to IV drug use (2023): 12.1 per 100,000 residents
- Reported new HIV cases in D.C. (2017): 365 total cases
- Reported new HIV cases rate (2017): 50.97 per 100,000
- 2004 AIDS rate in D.C.: 179.2 cases per 100,000 (more than 12 times the national rate of 14.9)
- Cumulative AIDS cases in the District: 16,165 total, with nearly one in four (24%) related to injection drug use
- 2004 demographics: More than three-quarters were male; 80% were African American; nearly three-quarters were between ages 20-44

Injection drug use continues to drive infectious disease transmission in the District decades into the HIV/AIDS epidemic.
Neonatal Impacts in the District
- Neonatal Opioid Withdrawal syndrome (2020): 5.3 per 1,000 births in the District
- Maternal drug use during pregnancy: Nearly 15% of new mothers in D.C. reported using illicit drugs
More than one in 200 babies born in the District experiences Opioid Withdrawal.
Emergency Department Burden in the District
- Emergency department opioid visits in D.C. (2017): 1,261 total visits
- ED opioid visits (D.C. residents only, 2017): 1,034 visits
- ED opioid visit rate (2017): 349.2 per 100,000 residents
- ED opioid visit rate (D.C. residents, 2017): 363.6 per 100,000
- EMS naloxone administrations in D.C. (2017): 1,556 administrations
- Drug/alcohol-related ER visits: Approximately 40% of 1.3 million annual ER visits in the District
The District’s healthcare system faces enormous strain from substance abuse.
Crime and Social Costs in the District of Columbia
Drug Arrests in the District (2005)
- Total drug-related arrests: 8,050 (juvenile and adult), down from 8,394 in 2004
- Opium and cocaine involvement: 56% of all drug-related arrests in D.C.
- Marijuana involvement: Approximately 40% of drug-related arrests in the District
- Sales vs. manufacturing: Accounted for 51-57% of all drug-related arrests in D.C. from 2001-2003
- Possession arrests: Accounted for slightly more than half of all drug-related arrests in the District in 2004 and 2005
- Juvenile arrests in D.C.: Nearly three-quarters for sales/manufacturing; more than half marijuana-related
- Adult arrests in D.C.: About 52% for possession since 2004; 56% involved opium or cocaine
- Drug seizure value in D.C. (2005): More than $26 million worth of drugs seized by Washington/Baltimore HIDTA initiative; 99% were marijuana and powder cocaine

Drug-related crime imposes enormous costs on the District’s criminal justice system and communities.
Social and Economic Costs in the District
- Total social costs in D.C.: More than $1.2 billion annually
- Including tobacco: More than $1.7 billion in total substance abuse costs to the District
- Comparison to other causes of death (2007): 90 drug-induced deaths vs. 54 motor vehicle accident deaths and 144 firearm deaths in D.C.
- Comparison to other causes of death (2010): 90 drug-induced deaths vs. 38 motor vehicle accident deaths and 99 firearm deaths in the District
The economic burden of substance abuse in the District exceeds $1.7 billion annually representing a massive drain on D.C.’s economy.
Homicides and Drugs in the District of Columbia
2010 Homicide Toxicology Data in D.C.
- Homicide cases in D.C.: 135 accepted by OCME with toxicology performed on 134
- Drug-negative cases: 48 homicide cases
- Drug-positive cases in D.C.: 86 cases
- Multiple drugs present: 15% of positive cases had more than one drug

Drugs Found in Homicide Victims in the District
| Drug | Number of Cases | % of 134 Homicide Cases |
| Marijuana Metabolites | 32 | 23.8% |
| Ethanol (Alcohol) | 30 | 22.4% |
| PCP | 11 | 8.2% |
| Cocaine | 10 | 7.4% |
| Morphine | 5 | 3.7% |
| MDMA | 3 | 2.2% |
The presence of drugs in nearly two-thirds of homicide victims in the District underscores the connection between substance abuse and violence in D.C..
District of Columbia faces a substance abuse crisis of extraordinary severity, with drug overdose deaths, substance use rates, and addiction prevalence far exceeding national averages across nearly every metric. With annual social costs exceeding $1.7 billion and thousands of lives lost in the nation’s capital, addressing the District of Columbia’s substance abuse epidemic requires massive expansion of treatment access, comprehensive harm reduction services, and targeted interventions in the most affected communities of Washington, D.C.
Statistical Data on Alcohol in District of Columbia
The District of Columbia faces significant challenges related to alcohol consumption, with rates consistently exceeding both regional and national averages across multiple metrics. The data reveals a concerning pattern of excessive drinking behaviors, substantial economic costs, and serious public health consequences. This comprehensive analysis examines alcohol consumption patterns, demographics of use, health consequences, economic impacts, and related criminal activity based on available data from multiple years of surveillance and reporting.
Health Consequences and Mortality Statistics
Alcohol-Related Deaths
- An average of 392 annual deaths are attributable to excessive alcohol use
- D.C. averages 1 death from excessive alcohol use for every 1,759 people aged 18+
- The 5-year average annual rate of excessive alcohol deaths per capita increased by 82.9% from 2015 to 2019
- 67.6% of people who die from excessive alcohol use are male
- 53.3% of excessive alcohol deaths are from chronic causes such as Alcohol Use Disorder
- 82.1% of deaths from excessive alcohol use are adults aged 35 years and older
- 3.32% of deaths from excessive alcohol use are under age 21

The increase in alcohol-related death rates represents a public health crisis.
Alcohol-Induced Deaths by Cause (2006-2010 totals)
- Mental and behavioral disorders due to alcohol use: 146 deaths
- Alcoholic liver disease: 145 deaths
- Accidental poisoning by and exposure to alcohol: 16 deaths
- Alcohol-induced acute pancreatitis: 11 deaths
- Alcohol cardiomyopathy: 9 deaths
- Alcohol-induced pancreatitis: 4 deaths
- Poisoning by and exposure to alcohol, undetermined intent: 3 deaths
- Degeneration of nervous system due to alcohol: 1 death
- Intentional self-poisoning by and exposure to alcohol: 1 death
- Alcohol gastritis: 1 death
Mental and behavioral disorders tied with liver disease as leading causes of alcohol-induced death, highlighting both acute psychiatric crises and long-term organ damage.
Alcohol Consumption Rates
Overall Adult Consumption (Ages 18+)
- 65.99% of adults aged 18+ consumed alcohol in the past month (2022-2023)
- 62.7% of respondents consumed at least one drink within the last 30 days (2010)
- D.C. ranked second nationally with 65.9% of adults having at least one drink in the past month
The District maintains exceptionally high alcohol consumption rates that have remained stable over time.
Binge Drinking Rates
- 33.05% of adults aged 18+ engaged in binge drinking in the past month (2022-2023)
- 22.5% of D.C. adults over 18 binge drink at least once per month
- 25.5% of adults were binge drinkers (consuming 5+ drinks for men, 4+ for women on one occasion)
- D.C. had the highest percentage of binge drinkers nationally at 24% compared to the national average of 17%
- Among binge drinkers, the median number of drinks per binge is 5.2
- The 25% most active binge drinkers consume a median 6.7 drinks per binge
- Binge drinkers engage in this behavior a median 1.5 times monthly
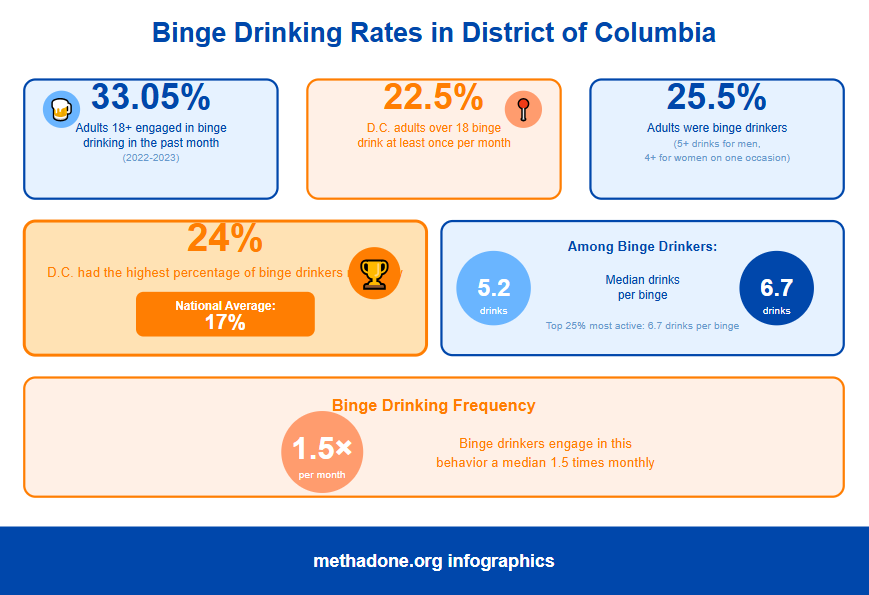
D.C.’s binge drinking rates are alarmingly high, leading the nation and demonstrating not only frequency but also intensity of consumption.
Heavy Drinking
- 11.1% of D.C. adults are heavy drinkers (consuming more than 2 drinks daily for men, more than 1 for women)
- D.C. ranked No. 1 nationally for percentage of heavy drinkers
- 28.9% of adults reported excessive drinking (binge or heavy drinking)
The District’s position as the nation’s leader in heavy drinking indicates a significant population struggling with sustained problematic alcohol use patterns.
Demographic Patterns of Alcohol Consumption
By Age Group (2010 data)
| Age Group | Any Alcohol Consumption (%) | Binge Drink (%) | Heavy Drinking (%) |
| 18–34 | 68.8% | 73.8% | 8.8% |
| 35–44 | 75.4% | 81.0% | 4.8% |
| 45–54 | 62.6% | 86.3% | 5.8% |
| 55–64 | 54.5% | 92.6% | 6.0% |
| 65+ | 43.6% | 95.3% | 4.5% |
Consumption peaks among adults aged 35-44, while binge drinking is highest among young adults.
Youth and Young Adult Alcohol Use
Youth (Ages 12-17)
- 8.58% consumed alcohol in the past month (2022-2023)
- 5.52% engaged in binge drinking in the past month (2022-2023)
- 11.1% of youth aged 12-17 used alcohol in the past month (2017-2019), similar to regional (9.1%) and national (9.4%) averages
- 8.2% of high school students were binge drinkers (2017)
- 20.5% of high school students reported using alcohol during the past month
- 9% of middle school students reported using alcohol during the past month
- 8.6% of children ages 12-17 reported drinking alcohol in the past month
Nearly one in five high school students still reports recent alcohol use, representing a substantial prevention challenge.
Young Adults (Ages 18-25)
- 66.50% (53,000 young adults) consumed alcohol in the past month (2022-2023)
- 43.40% (35,000) engaged in binge drinking in the past month (2022-2023)
- 51.2% (45,000 young adults) engaged in binge drinking during 2017-2019, significantly higher than both regional (37.9%) and national (35.4%) averages
Young adults in D.C. demonstrate the highest consumption rates of any age group.
Underage Drinking (Ages 12-20)
- 18.78% (9,000 people) aged 12-20 used alcohol in the past month (2022-2023)
- 9.65% (5,000 people) aged 12-20 engaged in binge drinking (2022-2023)
- An annual average of 4,000 youths aged 12-17 engaged in underage alcohol use (2002-2005)
- An annual average of 2,000 youths aged 12-17 engaged in binge drinking (2002-2005)
Underage drinking remains a persistent concern, with nearly one in ten youth engaging in binge drinking behavior.
Alcohol Use Disorder By Age Group
- Ages 12-17: 3.12% had alcohol use disorder (2022-2023)
- Ages 18-25: 22.45% had alcohol use disorder (2022-2023)
- Ages 18-25: 13.5% had alcohol use disorder (2017-2019), higher than regional and national averages of 9.8%
- Ages 26+: 16.45% had alcohol use disorder (2022-2023)
Young adults face the highest risk of alcohol use disorder, with more than one in five meeting diagnostic criteria.
Hospital Admissions for Alcohol-Related Problems (2006-2010)
Total admissions over 5 years: 1,619
By Year and Condition
| Year | Alcohol Psychosis (ICD-291) | Alcohol Dependence (ICD-303) | Non-dependent Abuse (ICD-305) |
| 2006 | 238 | 108 | 38 |
| 2007 | 191 | 94 | 39 |
| 2008 | 117 | 148 | 41 |
| 2009 | 181 | 123 | 37 |
| 2010 | 105 | 217 | 54 |
While alcohol psychosis admissions decreased by more than half, alcohol dependence admissions doubled from 2006 to 2010, indicating increasing severity of addiction requiring hospitalization.
Treatment Admissions (2011)
- 2,183 District adults aged 21+ were enrolled in treatment with alcohol as primary substance
- 41 youth under age 21 were enrolled in treatment with alcohol as primary substance
- 360 people were admitted into treatment for alcohol abuse alone
- 335 were admitted for alcohol combined with a secondary drug
- Approximately 82% of this treatment population was male
Treatment system data reveals males comprise the vast majority of those seeking formal intervention.
Traffic Safety and Alcohol
Motor Vehicle Crashes and Fatalities
- 48 people were killed in motor vehicle crashes in 2005
- Alcohol was involved in half of these crashes
- 44 fatal crashes occurred in 2005, with alcohol involved in 22 fatal crashes
- Of 48 fatalities: 19 were drivers, 16 were pedestrians, 6 were motorcyclists
- Of 19 drivers killed, 12 (63.2%) had been drinking alcohol prior to the crash

Alcohol’s involvement in half of fatal crashes and nearly two-thirds of driver deaths demonstrates its devastating impact on traffic safety.
Criminal Justice and Alcohol
Alcohol-Related Arrests (2007-2011)
| Year | Under 21 Drinking in Public | DUI Alcohol/Drugs | DWI-Liquor/Drugs | DUI Refusing Test | Possession Open Container |
| 2007 | 215 | 635 | 1,222 | 282 | 2,552 |
| 2008 | 212 | 470 | 856 | 252 | 2,395 |
| 2009 | 203 | 733 | 882 | 276 | 2,310 |
| 2010 | 254 | 842 | 700 | 341 | 2,335 |
| 2011 | 153 | 1,046 | 378 | 376 | 2,588 |
| Total | 1,037 | 3,726 | 4,038 | 1,527 | 12,180 |
DUI arrests increased dramatically from 635 in 2007 to 1,046 in 2011, while DWI arrests decreased.
Economic Impact
- $918.4 million spent by D.C. taxpayers due to excessive alcohol use in 2010
- Equivalent to $1.240 billion in 2022 dollars (adjusted for inflation)
- Cost equivalent to $2.89 per drink in 2022 dollars
- $0.24 per drink sold in total federal and state alcohol taxes (2010)

The economic burden of excessive drinking vastly exceeds tax revenue collected, with costs twelve times higher than taxes per drink.
The comprehensive data reveals the District of Columbia faces a severe and multifaceted alcohol crisis characterized by the nation’s highest rates of binge and heavy drinking, alcohol use disorder rates double the national average, dramatic increases in alcohol-related deaths, and economic costs exceeding $1 billion. The data indicates urgent need for comprehensive prevention, treatment expansion, policy interventions, and targeted approaches addressing demographic disparities and the concentrated impacts on vulnerable populations.
Conclusion
In general, the District of Columbia faces a catastrophic substance abuse crisis, with overdose death rates 163% above the national average and the nation’s highest rates of binge and heavy drinking. Combined annual costs exceed $1.7 billion, while only 1.3% of the 137,000 residents with substance use disorders receive treatment. The epidemic disproportionately impacts African American residents and concentrated communities in Wards 5, 7, and 8, with fentanyl driving 98% of opioid deaths. Without immediate expansion of treatment access and comprehensive harm reduction services, this public health emergency will continue devastating lives and communities across the nation’s capital.
Sources:
- Drug Abuse Statistics
- National Survey on Drug Use and Health: 2022‑2023 State-Specific Tables of Model-Based Estimates (Totals and Percentages)
- Behavioral Health Barometer: District of Columbia, Volume 6
- Explore Non-Medical Drug Use – Past Year in District of Columbia | AHR
- DC ranks among worst areas for drug problems in US, study finds | FOX 5 DC
- Opioid overdose deaths in DC reached record high in 2023, new report shows
- Alcohol & Substance Use – Our Healthy DC
- A SUBSTANCE ABUSE STRATEGY FOR THE DISTRICT OF COLUMBIA
- Opioid Use in D.C. | Howard University Hospital
- Drug Use Statistics In Washington, DC | Recovery Connection
- How many drug overdose deaths happen every year in Washington, DC? | USAFacts
- Substance Abuse in Washington, D.C.
- Addiction in the Nation’s Capital
- DISTRICT OF COLUMBIA DRUG CONTROL UPDATE
- ALCOHOL An Equal Opportunity Destroyer
- Explore Excessive Drinking in District of Columbia | AHR
- Addressing Excessive Alcohol Use: State Fact Sheets
- DC has highest percentage of heavy drinkers – WTOP News
- Explore Alcohol Use – Youth in District of Columbia | AHR