Statistical Data on Drugs in Alaska
Alaska is experiencing one of the most severe drug crises in the United States, with substance use rates consistently ranking among the highest nationally. The state’s overdose death rate of 49.5 per 100,000 residents far exceeds the national average, marking Alaska as having one of the fastest-rising overdose mortality rates in the country. This crisis is characterized by widespread opioid deaths—particularly from synthetic fentanyl—combined with significant methamphetamine involvement in over half of all fatal overdoses. Geographic isolation, limited treatment infrastructure, and profound health disparities among Alaska Native populations compound these challenges. The following statistics provide a comprehensive overview of drug use, overdose deaths, treatment access, and law enforcement data that illustrate the scope and urgency of Alaska’s substance abuse emergency.
Overdose Death Statistics
Overall Overdose Deaths
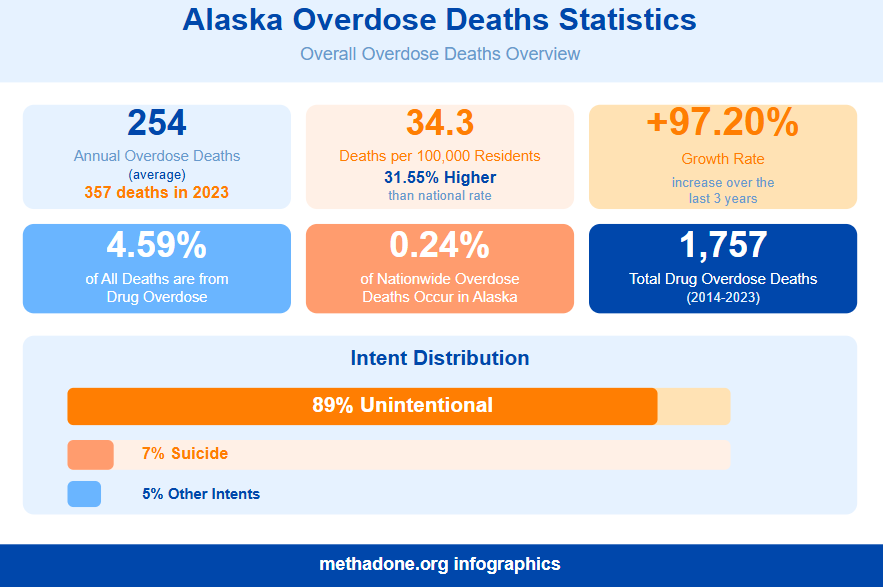
- Annual overdose deaths: 254 per year (average), with 357 deaths in 2023
- Overdose death rate: 34.3 deaths per 100,000 residents (31.55% higher than national rate)
- Growth rate: 97.20% increase over the last 3 years
- Percentage of all deaths: 4.59% are from drug overdose
- National proportion: 0.24% of nationwide overdose deaths occur in Alaska
- Historical trend (2014-2023): 1,757 total drug overdose deaths
- Intent distribution: 89% unintentional, 7% suicide, 5% other intents
Deaths by Year
| Year | Unintentional | Suicide | Other | Total Deaths | Death Rate per 100,000 |
| 2014 | 101 | 16 | 6 | 123 | 16.6 |
| 2015 | 105 | 9 | 7 | 121 | 16.0 |
| 2016 | 106 | 13 | 10 | 129 | 17.1 |
| 2017 | 119 | 16 | 6 | 141 | 19.3 |
| 2018 | 91 | 6 | 8 | 105 | 14.0 |
| 2019 | 110 | 15 | 8 | 133 | 18.1 |
| 2020 | 127 | 10 | 9 | 146 | 20.0 |
| 2021 | 238 | 9 | 8 | 255 | 35.2 |
| 2022 | 228 | 8 | 11 | 247 | 33.7 |
| 2023 | 331 | 14 | 12 | 357 | 49.5 |
Alaska’s overdose crisis has accelerated dramatically, with the death rate now 31.55% higher than the national average. The 44.5% increase from 2022 to 2023 represents one of the steepest rises in the country.
Demographics of Overdose Deaths (2023)
By Sex
- Men: 225 deaths (59.3 per 100,000)
- Women: 132 deaths (38.8 per 100,000)
By Race/Ethnicity
- American Indian/Alaska Native: 119 deaths (114.6 per 100,000)
- Black: 23 deaths (84.6 per 100,000)
- Multiple races: 31 deaths (72.3 per 100,000)
- White: 170 deaths (34.2 per 100,000)
- Hispanic: 19 deaths (37.4 per 100,000)
By Region
- Anchorage: 230 deaths (79.9 per 100,000) – highest rate
- Southeast: 29 deaths (40.1 per 100,000)
- Mat-Su: 37 deaths (32.3 per 100,000)
- Gulf Coast: 22 deaths (26.6 per 100,000)
- Interior: 27 deaths (25.1 per 100,000)
- Southwest: 9 deaths (23.0 per 100,000)
By Age Group
- 35-44 years: 115 deaths (110.0 per 100,000) – highest rate
- 45-54 years: 67 deaths (81.8 per 100,000)
- 25-34 years: 75 deaths (70.5 per 100,000)
- 55-64 years: 51 deaths (58.1 per 100,000)
- 15-24 years: 27 deaths (27.2 per 100,000)
Significant disparities exist across demographic groups, with American Indian/Alaska Native people experiencing rates more than three times higher than White residents.
Deaths by Drug Type
Opioid Epidemic
Opioid Overdose Statistics
- Total opioid deaths (2023): 290 deaths
- Opioid death rate: 40.1 per 100,000 (67.1% higher than national rate)
- Proportion of all overdoses: 80.8% involve opioids
- Synthetic opioid involvement: 94.5% of opioid deaths
- Heroin involvement: 5.5% of opioid deaths
- Prescription opioid involvement: 11.0% of opioid deaths
- Neonatal withdrawal (2020): 26.6 per 1,000 births
- Prescription rate: Enough for 30.4% of residents
- HIV/AIDS from IV drug use: 1.8 new diagnoses in 2023

Opioid Deaths by Type (2023)
Historical Trend: Fentanyl deaths increased by 193% from 2019 to 2020, with fentanyl accounting for approximately 49% of all drug overdoses in 2020.
| Drug Type | Deaths | Rate per 100,000 |
| Total Opioids | 286 | 39.8 |
| Other Synthetic Narcotics (primarily fentanyl) | 270 | 37.9 |
| Fentanyl (specifically cited) | 265 | 37.2 |
| Analgesic Opioids | 283 | 39.4 |
| Other Opioids | 34 | 4.6 |
| Heroin | 16 | 2.1 |
| Methadone | 14 | 1.9 |
Opioids drive 80.8% of all overdose deaths, with synthetic opioids like fentanyl involved in nearly all opioid deaths. Alaska’s opioid death rate is 67.1% higher than the national rate.
Methamphetamine and Stimulant Deaths
- Psychostimulant deaths (2023): 198 deaths (27.2 per 100,000)
- Methamphetamine deaths (2023): 193 deaths (26.5 per 100,000)
- Percentage of overdoses involving methamphetamine: Over 50% (2017-2023)
- Rate increase: 25% increase in methamphetamine-related deaths from 2017 to 2023
- Multi-drug involvement: Approximately 60% of overdoses involve multiple drugs

Methamphetamine has emerged as a major contributor to Alaska’s overdose crisis, with over half of fatal overdoses involving methamphetamine, often in combination with opioids.
Other Drug-Related Deaths (2023)
| Drug Category | Deaths | Rate per 100,000 |
| Sedatives | 52 | 7.1 |
| Cocaine | 31 | 4.1 |
| Antidepressants | 28 | 3.6 |
| Antipsychotics | 12 | 1.6 |
While sedatives, cocaine, and psychiatric medications account for fewer deaths than opioids and methamphetamine, their presence in 69% of multi-drug overdoses highlights their role as dangerous secondary substances that increase overdose risk when combined with other drugs.
Emergency Department Visits (March 2024 – March 2025)
- Opioid-related ED visits: 91 (March 2025)
- All drug-related ED visits: 251 (March 2025)
- Opioid overdose deaths (12-month period): 245
Note: Recent 12-month overdose totals are more than 10% below the previous 12-month period, suggesting potential stabilization.
The recent 10% decline in overdose deaths over the past 12 months offers cautious optimism, though opioids still account for over one-third of all drug-related emergency visits, indicating the crisis remains severe despite signs of potential stabilization.
Substance Use Rates
Past-Month Illicit Drug Use (2022-2023)
| Age Group | Alaska Rate | U.S. Census Division | National Average |
| 12+ | 23.01% | 18.5% | 15.9% |
| 12-17 | 6.52% | – | – |
| 18-25 | 31.15% | – | – |
| 26+ | 23.96% | – | – |
Past-Month Marijuana Use (2022-2023)
| Age Group | Alaska Rate | U.S. Census Division | National Average |
| 12+ | 22.31% | 17.0% | 14.5% |
| 12-17 | 4.99% | – | – |
| 18-25 | 28.26% | – | – |
| 26+ | 23.67% | – | – |
Youth Substance Use (12-17 years)
- Past-month drug use: 4,000 youth (6.52%)
- Marijuana use in past year: 10.61%
- Past-month alcohol use: 6.40%
- Cocaine use in past year: 0.18%
- Methamphetamine use in past year: 0.05%
- Pain reliever misuse in past year: 2.22%
- Drug use disorder in past year: 6.41%
- Alcohol use disorder in past year: 2.25%
Young Adult Substance Use (18-25 years)
- Past-month drug use: 21,000 individuals (31.15%)
- Past-year marijuana use: 41.76%
- Cocaine use in past year: 2.75%
- Substance use disorder: 30.71%
- Drug use disorder: 27.04%
Alaska consistently exceeds national averages for illicit drug use across all age groups, with marijuana use particularly elevated. Unsurprisingly, the use of THC detox kits is also prevalent there.
Substance Use Disorders
Past-Year Substance Use Disorder Rates (2022-2023)
| Age Group | Substance Use Disorder | Drug Use Disorder |
| 12+ | 21.11% | 13.32% |
| 12-17 | 8.34% | 6.41% |
| 18-25 | 30.71% | 27.04% |
| 26+ | 21.39% | 12.26% |
Comparison to National Averages (2021-2023)
- Alaska substance use disorder: 21.6%
- U.S. census division: 17.4%
- National average: 17.0%
Specific Use Disorders (12+ population, 2022-2023)
- Pain reliever use disorder: 1.59%
- Opioid use disorder: 2.07%
- Opioid misuse in past year: 3.18%
Alaska has significantly higher rates of substance use disorders than national averages, affecting more than one in five residents.
Treatment Statistics
Treatment Access and Gaps
- Received substance use treatment (past year): 4.56% of population 12+
- Classified as needing treatment: 22.34%
- Not receiving treatment among those needing it: 78.91%
- Youth not receiving treatment (12-17): 60.58%
- Young adults not receiving treatment (18-25): 86.09%
Treatment Enrollment (Single-Day Count, March 2019)
- Total enrolled in treatment: 9,477 patients
- Outpatient services: 9,070 patients annually
- Residential (non-hospital) services: 399 patients
- Hospital services: 8 clients
- Treatment focus: 68.0% drug only, 12.5% alcohol only, 19.5% both
Historical Treatment Data (2010)
Total in rehab: 6,699 people (61% male, 39% female)
- Marijuana dependence treatment: 524 people (43.3% ages 12-17)
- Opiates other than heroin: 340 people (63.5% female)
- Amphetamines: 182 individuals (57.7% female)
- Cocaine: 167 people (73.8% female)
Medication-Assisted Treatment (March 2019)
- Methadone recipients: 848 people (increase from 331 in 2015)
- Buprenorphine recipients: 120 people (increase from 91 in 2015)
Despite high rates of substance use disorders, the vast majority of those needing treatment do not receive it, with only about one in five getting the help they need. Instead, some individuals use detox shampoos for job-related reasons.
Treatment Facilities and Costs
Cost of Rehabilitation
| Service Type | Average Individual Cost | Total Public Spending | Percent of U.S. Total |
| Outpatient | $1,783 | $16.17 million | 0.7% |
| Residential (non-hospital) | $52,030 | $20.76 million | 0.4% |
Note: Alaska ranks 2nd cheapest for residential rehabilitation nationally but is among the top 10 most expensive for outpatient treatment.
Treatment Infrastructure
- Active substance abuse centers: 101 facilities
- Free treatment facilities: 1
- Historical decline: From 87 facilities in 2002 to 70 in 2006

Alaska has limited treatment infrastructure with costs among the most expensive in the nation for outpatient services, though residential treatment ranks as second cheapest nationally.
Drug Seizure Data
Total Seizures (2023-2024)
| Drug Type | 2023 (grams) | 2024 (grams) | Percent Change |
| Fentanyl | 83,260.74 | 93,853.94 | +13% |
| Methamphetamine | 78,581.43 | 148,316.16 | +89% |
| Marijuana | 84,514.88 | 144,877.25 | +71% |
| Marijuana Edibles | 11,701.16 | 64,128.14 | +448% |
| THC Liquid | 4,061.50 | 62,745.01 | +1,445% |
| Cocaine | 32,118.46 | 30,818.64 | -4% |
| Heroin | 9,460.62 | 14,875.95 | +57% |
| Alprazolam | 138.81 | 1,404.60 | +912% |
| TOTAL | 324,766.64 | 572,536.90 | +76% |
Geographic Distribution of Seizures (2024)
Anchorage Borough: 78.3% of all seizures
- 94.7% of heroin seizures
- 87.3% of cocaine seizures
- 79.3% of methamphetamine seizures
- 71% of fentanyl seizures
Other boroughs:
- Fairbanks North Star Borough: 12.1%
- City and Borough of Juneau: 2.5%
- Matanuska-Susitna Borough: 2.4%
Historical Seizure Data (2021)
- Marijuana: 49,078 grams
- Methamphetamine: 25,838 grams
- Heroin: 9,296 grams
- Cocaine: 6,320 grams
- Fentanyl: 612 grams
Law enforcement seizures show dramatic increases in most drug categories, with total seizures up 76% from 2023 to 2024. The Municipality of Anchorage accounts for the overwhelming majority of seizures.
Criminal Justice System
Court Dispositions (Drug Cases)
- Guilty: 223 cases
- Dismissed: 182 cases
- Suspended imposition of sentence: 18 cases
- Total drug cases: 425
Average Sentences for Drug Convictions
- Jail time: 88 days average
- Suspended jail time: 110 days average
- Probation: 180 days (2 years) average
- Prison time: 3 years average
- Fine: $250 average
- Restitution: $26,230.50 average
Most Common Drug Offenses
- Possession (any amount) IA, IIA, IIIA, IVA, VA: 106 convictions
- Manufacture/Deliver any IIA or IIIA: 93 convictions
- Manufacture/Deliver IA: 53 convictions
- Previous conviction within 10 years: 47 convictions
Drug convictions result in significant incarceration and financial penalties, with manufacturing and delivery charges most common. Many court decisions are based on hair drug testing results.
Street Prices of Drugs
| Drug Type | Location | Quantity | Price |
| Cocaine | Anchorage | 8-ball | $350 |
| Cocaine | Fairbanks | Gram | $100 |
| Fentanyl Pill | Anchorage | Pill | $8 |
| Fentanyl Pill | Ketchikan | Pill | $50 |
| Fentanyl Pill | Kodiak | Pill | $30-$80 |
| Fentanyl Powder | Fairbanks | 1/10 gram | $80-$100 |
| Methamphetamine | Anchorage | Ounce | $300-$500 |
| Methamphetamine | Ketchikan | Gram | $150 |
| Heroin | Juneau | Gram | $100 |
Drug prices vary significantly across Alaska’s regions, with remote communities like Ketchikan and Kodiak paying up to six times more for fentanyl pills than Anchorage, reflecting transportation challenges and limited Supply in isolated areas.
Alaska faces a severe and escalating substance abuse crisis that significantly exceeds national averages across nearly all metrics. The dramatic 97% increase in overdose deaths over three years, driven primarily by synthetic opioids like fentanyl and methamphetamine, demands urgent intervention. With nearly 79% of those needing treatment unable to access it and profound disparities affecting American Indian/Alaska Native communities at rates three times higher than other populations, comprehensive solutions addressing both treatment capacity and cultural competency are critical. The concentration of drug activity in Anchorage, combined with Alaska’s unique geographic challenges, requires targeted prevention, harm reduction, and expanded treatment resources to reverse current trends.
Statistical Data on Alcohol in Alaska
Alaska faces significant challenges with alcohol-related issues, ranking second nationally in alcohol-related deaths per capita and first in female alcohol-related deaths. The state’s unique characteristics, including remote communities with varying alcohol regulations and distinctive drinking patterns, contribute to a complex public health landscape. This report synthesizes available data on alcohol use, deaths, treatment, and legal enforcement across different age groups and timeframes.
Alcohol-Related Deaths Statistics
- Annual average deaths: 433
- Deaths under age 21: 3.9% (17 deaths)
- Death rate: 7.83 per 10,000 adults (1 death per 1,694 people aged 18+)
- Male deaths: 65.4%
- Deaths from chronic causes (e.g., Alcohol Use Disorder): 52.4%
- Deaths among adults 35+: 77.1%
- Years of potential life lost annually: 13,285

The high death rate, particularly among males and older adults, reflects long-term patterns of excessive alcohol consumption. The majority of deaths stemming from chronic causes indicates sustained alcohol abuse rather than acute incidents. The 45% increase in the 5-year average annual death rate (2015-2019) suggests worsening conditions requiring urgent intervention.
Adult Alcohol Use Patterns (Ages 18+, 2022-2023)
Prevalence Rates
- Past-month alcohol use: 51.50% (272,000 people)
- Binge drinking in past month: 21.06% (111,000 people)
- Alcohol Use Disorder: 10.89% (58,000 people)
Binge Drinking Characteristics
- Median drinks per binge: 5.4
- Median drinks per binge (most active 25%): 7.1
- Median binge frequency: 1.9 times monthly
- Binge frequency (most active 25%): 4.4 times per month
Over half of Alaskan adults consume alcohol monthly, with approximately one in five engaging in binge drinking. The 2021-2023 binge drinking rate (20.5%) was comparable to national (21.7%) and regional (20.7%) averages. However, the Alcohol Use Disorder rate (11.2% in 2021-2023) exceeded the national average (10.4%), indicating more problematic drinking patterns despite similar binge rates.
Youth Alcohol Use (Ages 12-17)
Current Use (2022-2023)
- Past-month alcohol use: 6.40% (4,000 youth)
- Past-month binge drinking: 3.16% (2,000 youth)
- Alcohol Use Disorder: 2.52% (1,000 youth)
Historical Trends
Past-month use decreased from higher levels in 2002-2004 to 8.7% in 2017-2019
Age-Specific Patterns (Additional Data)
- Ages 12-14: 5.5% past-month use, 2.4% binge drinking
- Ages 15-17: 24.0% past-month use, 14.7% binge drinking
Youth alcohol use in Alaska has declined over time, with 2017-2019 rates (8.7%) similar to national averages (9.4%). However, a dramatic increase occurs in the 15-17 age group, where nearly one-quarter report past-month use, indicating middle-to-late adolescence as a critical intervention period.
Young Adult Patterns (Ages 18-25, 2022-2023)
Use Rates
- Past-month alcohol use: 42.11% (28,000)
- Past-month binge drinking: 23.55% (16,000)
- Alcohol Use Disorder: 15.27% (10,000)
Historical Context
- Binge drinking remained stable at 33.5% during 2017-2019 (comparable to national 35.4%)
- Alcohol Use Disorder decreased from higher rates in 2002-2004 to 13.3% in 2017-2019
Young adults show the highest rates of Alcohol Use Disorder across age groups (15.27%), though this has improved from earlier periods. The 2017-2019 rate (13.3%) exceeded the national average (9.8%), identifying this demographic as particularly vulnerable and requiring targeted prevention efforts.
Underage Drinking (Ages 12-20)
Combined Youth Statistics
- Past-month alcohol use: 12.52% (11,000)
- Past-month binge drinking: 6.72% (6,000)
- Alcohol Use Disorder: 5.13% (4,000)
Detailed Age Breakdown
- Ages 18-20: 44.2% past-month use, 32.7% binge drinking (13,000 and 10,000 individuals)
The sharp escalation in drinking from ages 12-17 to 18-20 demonstrates the impact of legal and social transitions. Nearly half of 18-20 year-olds report monthly alcohol use, with one-third binge drinking, substantially higher than younger teens.
Risk Perceptions
Perception of Great Risk from 5+ Drinks Once/Twice Weekly
- Overall (ages 12+): 42.22% (248,000)
- Ages 12-17: 39.28% (23,000)
- Ages 18-25: 37.24% (25,000)
- Ages 26+: 43.29% (200,000)
- Ages 12-20: 38.74% (33,000)
Less than half of Alaskans perceive regular heavy drinking as high-risk, with young adults showing the lowest concern (37.24%). This reduced risk perception among those with highest use rates may contribute to problematic drinking patterns.
Treatment and Addiction
- Admissions for alcohol as primary substance (2010): 2,961
- Admissions for alcohol with secondary drug (2010): 2,027
- Total treatment admissions: 4,988
Nearly 5,000 treatment admissions in 2010 demonstrate substantial need for intervention services, with alcohol being the primary concern for most admissions.
Alcohol Enforcement and Legal Issues
Seizures (2024)
- Total volume: 8,504.3 liters (2,439 bottles)
- Breakdown: 8,407.22L distilled spirits, 39.33L malted beverages, 57.75L wine
- Increase: Nearly 400% compared to 2023
Primary Offenses
- Import alcohol to dry area (small amount): 33 convictions (30 guilty)
- Import alcohol to dry area (large amount): 15 convictions (9 guilty)
- Sell alcohol without license (dry area): 12 convictions (5 guilty)
Conviction Statistics
- Average jail sentence: 67 days
- Average jail suspended: 83 days
- Average probation: 2 years
- Average fine: $2,800
- Average suspended fine: $3,500
The dramatic increase in alcohol seizures reflects enforcement challenges in local option communities where alcohol is prohibited. The concentration of convictions around importation violations highlights the complexity of Alaska’s mixed regulatory environment.
Traffic Safety
Fatal Crashes Involving Alcohol (Ages 15-20)
- Drivers with BAC > 0.01: 13.0% of all traffic fatalities (1 driver)
While the absolute number is small, any youth traffic fatality involving alcohol represents a preventable tragedy requiring continued education and enforcement.
Economic Impact
- Direct taxpayer costs (2010): $827.2 million
- Inflation-adjusted cost (2022): $1.17 billion
- Cost per drink: $3.04

The economic burden of excessive alcohol use is substantial, exceeding $1 billion annually when adjusted for inflation, representing significant healthcare, law enforcement, and productivity costs.
Alaska’s alcohol crisis demands comprehensive intervention across multiple fronts. With the nation’s second-highest per capita alcohol-related death rate, economic costs exceeding $1 billion annually, and Alcohol Use Disorder rates surpassing national averages—particularly among young adults at 15.27%—the state faces urgent public health challenges. The dramatic 400% increase in alcohol seizures and persistent enforcement issues in local option communities highlight the complexity of Alaska’s regulatory landscape. Targeted prevention programs focusing on young adults, enhanced treatment accessibility, and strengthened community-based interventions are essential to reduce the devastating human and economic toll of excessive alcohol use.
Conclusion
In general, Alaska faces a dual substance crisis of unprecedented severity. The state’s overdose death rate of 49.5 per 100,000—driven primarily by fentanyl and methamphetamine—ranks among the nation’s highest and has nearly doubled in just three years, with American Indian/Alaska Native populations experiencing rates over three times higher than other groups. Simultaneously, Alaska leads the nation in female alcohol-related deaths and ranks second overall, with economic costs exceeding $1 billion annually and Alcohol Use Disorder affecting 11% of adults. Despite these alarming trends, nearly 79% of those needing substance abuse treatment cannot access it, revealing a critical gap between the scale of the crisis and available intervention resources that demands immediate, comprehensive action across prevention, treatment infrastructure, and culturally competent care delivery.
Sources:
- Drug Abuse Statistics
- ALASKA – National Survey on Drug Use and Health
- Behavioral Health Barometer Alaska | Volume 8
- Behavioral Health Barometer: Alaska, Volume 6
- 2024 Annual Drug Report
- Drug Stats – SDEU – AST – Alaska Department of Public Safety
- Methamphetamine a big contributor to Alaska’s opioid-dominated overdose deaths, report says
- 2023 Drug Overdose Mortality Update
- Drug Abuse: Facts, Rates, and Statistics | Banyan
- Substance Abuse In Alaska Statistics | Recovery Connection
- Alaska Substance Use Dashboard
- Report to Congress on the Prevention and Reduction of Underage Drinking 20