Statistical Data on Drugs in Vermont
Vermont faces one of the most severe substance abuse challenges in the United States, consistently ranking among the top states for illicit drug use across multiple categories. The state’s rural character, combined with its proximity to major drug trafficking routes from Canada and northeastern urban centers, has created a complex public health crisis. This report synthesizes comprehensive data on drug use patterns, overdose deaths, treatment admissions, and demographic trends in Vermont, revealing a state grappling with particularly high rates of marijuana use, a devastating opioid epidemic dominated by fentanyl, and emerging concerns about stimulant abuse.
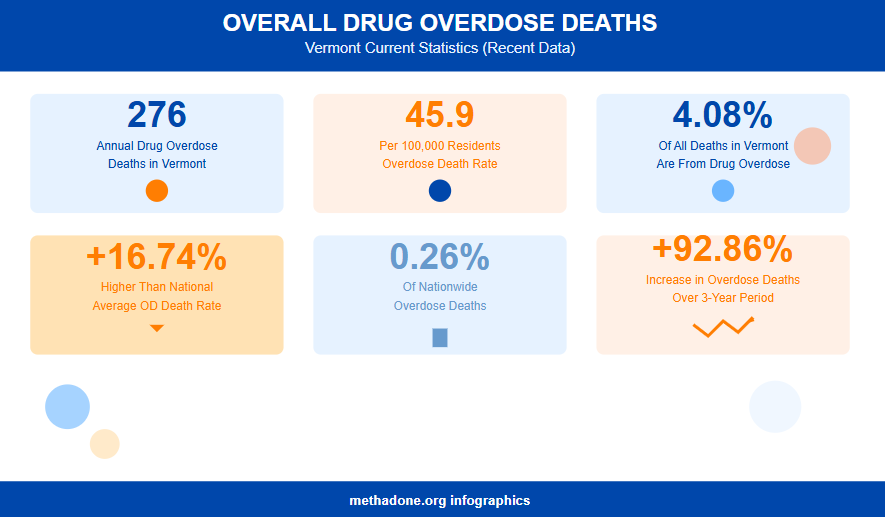
Overall Drug Overdose Deaths
Current Statistics (Recent Data)
- 276 drug overdose deaths occur annually in Vermont
- Overdose death rate: 45.9 per 100,000 residents
- 4.08% of all deaths in Vermont are from drug overdose
- Vermont’s OD death rate is 16.74% higher than the national average
- Vermont accounts for 0.26% of nationwide overdose deaths
- Overdose deaths increased 92.86% over a 3-year period
Historical Context
- 2007: 68 drug-induced deaths (10.9 per 100,000)
- 2009: 57 drug-induced deaths (9.2 per 100,000)
- Both years showed rates below national averages at the time
Vermont has experienced a dramatic escalation in overdose mortality, with deaths nearly quadrupling from 2009 to present.
Opioid Crisis
Opioid Overdose Deaths
Current Statistics
- 232 opioid-related fatal overdoses (38.2 per 100,000)
- Opioids account for 89.6% of all overdose deaths
- Vermont’s opioid death rate is 59.2% higher than the national rate
- Synthetic opioids (fentanyl) involved in 94.8% of opioid deaths
- Heroin involved in 4.3% of opioid deaths
- Prescription opioids involved in 7.8% of opioid deaths
Historical Trend
- 2010: 4 fentanyl-related deaths
- 2018: 69 heroin-related deaths (peak)
- 2020: 158 opioid-related fatal overdoses
- 2021: 210 opioid-related fatal overdoses (33% increase from 2020)
- 2021: 196 fentanyl deaths, 20 heroin deaths, 48 prescription opioid deaths
The opioid crisis has fundamentally transformed from heroin and prescription opioids to fentanyl-dominated mortality.
Additional Opioid Impact
- Neonatal Opioid Withdrawal syndrome: 61.4 per 1,000 births (2020)
- Prescription rate: enough for 27.9% of residents
- Hepatitis C cases linked to IV drug use: 11.4 per 100,000 (2022)
- HIV/AIDS diagnoses linked to IV drug use: 0.6 per 100,000 (2023)
- Naloxone reversals: 176 reported overdoses reversed (2021)
- Estimated lives saved by naloxone (2014-2021): 2,392
The opioid crisis extends beyond mortality to affect newborns, infectious disease transmission, and healthcare systems. The high rate of neonatal withdrawal syndrome indicates widespread opioid use among pregnant women.
Substance Use Prevalence
Current Population-Wide Use (2022-2023 Annual Averages)
| Substance/Measure | Age 12+ | Age 12-17 | Age 18-25 | Age 26+ |
| Past-Month Illicit Drug Use | 27.15% | 10.31% | 43.34% | 26.18% |
| Past-Year Marijuana Use | 34.26% | 14.02% | 58.69% | 32.32% |
| Past-Month Marijuana Use | 25.33% | 8.55% | 42.05% | 24.27% |
| Past-Year Cocaine Use | 2.39% | 0.19% | 6.86% | 1.89% |
| Past-Year Heroin Use | — | — | 0.73% | 0.40% |
| Past-Year Hallucinogen Use | 5.59% | 1.44% | 19.12% | 3.85% |
| Past-Year Methamphetamine Use | 1.06% | 0.19% | 0.72% | 1.19% |
| Past-Year Prescription Pain Reliever Misuse | 2.56% | 1.77% | 2.69% | 2.61% |
| Past-Year Opioid Misuse | 2.66% | 1.73% | 2.71% | 2.74% |
Vermont shows exceptionally high substance use rates, particularly for marijuana and among young adults. Local inhabitants also often use various THC detox methods.
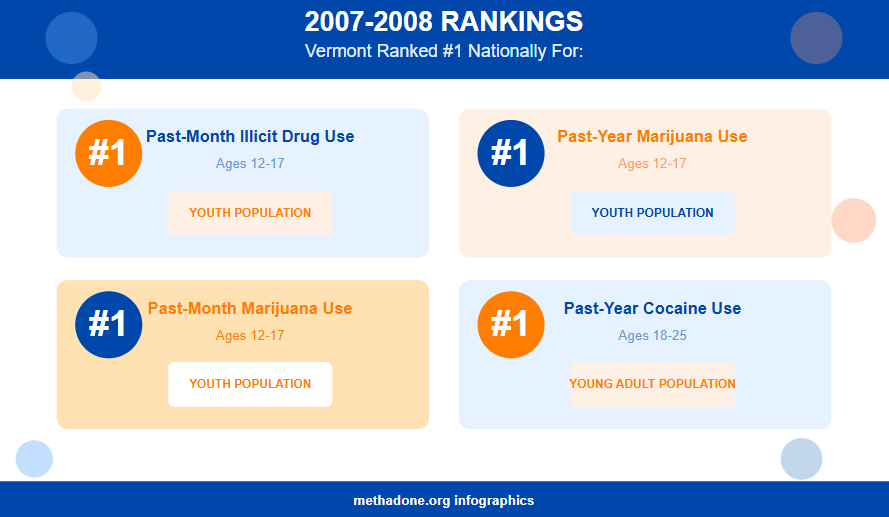
Historical Comparisons
2007-2008 Rankings: Vermont ranked #1 nationally for
- Past-month illicit drug use (ages 12-17)
- Past-year marijuana use (ages 12-17)
- Past-month marijuana use (ages 12-17)
- Past-year cocaine use (ages 18-25)
2009-2010 Statistics
- 13.73% of Vermont residents used illicit drugs in past month (national: 8.82%)
- 4.57% used illicit drugs other than marijuana (national: 3.6%)
2017-2019 Statistics
- Youth (12-17): 15.5% past-month illicit drug use (regional: 12.1%, national: 8.2%)
- Youth (12-17): 14.5% past-month marijuana use (regional: 10.8%, national: 6.8%)
- Young adults (18-25): 53.6% past-year marijuana use (regional: 46.4%, national: 35.0%)
Vermont has consistently ranked among the highest states for drug use for over 15 years. The state’s rates have remained 1.5-2 times higher than national averages across multiple time periods, indicating persistent structural factors driving elevated substance use.
Youth Drug Use
Current Youth Statistics (Ages 12-17)
- Vermont teens are 42.11% more likely to have used drugs than average American teens
- Vermont teens are 38.96% less likely to use alcohol than national average
- 4,000 teens (10.31%) used drugs in last month
- 14.02% used marijuana in past year
- 0.19% used cocaine in past year
- 0.19% used methamphetamine in past year
- 1.77% misused prescription pain relievers in past year
- 9.56% used alcohol in past month
National Rankings
- Vermont ranks 48th (3rd highest) for youth illicit drug use
- 13.92% of teens used illicit drugs (2020 data)
- 2.3 times higher than Utah (lowest at 6.02%)
Vermont youth show paradoxical substance use patterns—significantly higher drug use but lower alcohol use compared to national averages.
Young Adult Drug Use (Ages 18-25)
Current Statistics
- 31,000 young adults used drugs in past month
- 62.27% more likely to use drugs than average Americans in same age group
- 43.34% used illicit drugs in past month
- 58.69% used marijuana in past year
- 42.05% used marijuana in past month
Historical Data (2017-2019)
- Past-year marijuana use: 53.6% (vs. 35.0% national)
- Marijuana use increased significantly between 2002-2004 and 2017-2019 (based on the results of hair and other drug tests)
- 8.3% had marijuana use disorder
- 21.1% had substance use disorder
Young adults in Vermont face the highest substance abuse rates of any age group, with nearly half using illicit drugs monthly and a majority using marijuana annually. It’s also worth mentioning thta they actively use special shampoos to cheat drug tests.
Substance Use Disorders
Current Disorder Rates (2022-2023)
| Disorder Type | Age 12+ | Age 12-17 | Age 18-25 | Age 26+ |
| Any Substance Use Disorder | 20.58% | 8.33% | 35.50% | 19.38% |
| Drug Use Disorder | 13.03% | 7.26% | 26.64% | 11.44% |
| Pain Reliever Use Disorder | 2.14% | 1.00% | 1.07% | 2.41% |
| Opioid Use Disorder | 2.02% | 1.00% | 1.23% | 2.24% |
Absolute Numbers (in thousands)
- 117,000 people with substance use disorder
- 74,000 people with drug use disorder
- 12,000 people with opioid use disorder
Historical Context (2017-2019)
- Overall population: 10.3% had substance use disorder (vs. 7.4% national)
- Young adults: 21.1% had substance use disorder (vs. 14.7% national)
- Overall population: 4.2% had illicit drug use disorder (vs. 2.9% national)
Over one-fifth of Vermonters aged 12+ meet criteria for substance use disorder—nearly triple the typical national rate.
Emerging Threats
Fentanyl Adulterants
- DEA warning: 6 in 10 counterfeit pills contain lethal fentanyl dose (2022)
- 23% of fentanyl powder and 7% of pills contain xylazine (2023)
Route of Administration Shift
- Fatal overdoses from injection decreased 10% (2019-2023)
- Fatal overdoses from smoking increased 300% (same period)
The drug Supply is becoming more dangerous with xylazine-adulterated fentanyl and a shift toward smoking, which may be attracting users who avoid injection but still face high overdose risk.
Drug-Specific Trends
Marijuana
- 2000: 1,223 marijuana treatment admissions
- 2001: 1,366 marijuana treatment admissions (+12%)
- 2010: 1,228 marijuana treatment admissions (68.7% male, 31.3% female)
Marijuana remains the most commonly abused illicit drug in Vermont, with consistently high treatment admission rates. Many people also engage in THC detox at home, which poses certain health risks.
Heroin
Historical Admission Data
- FY2000: 373 heroin treatment admissions
- FY2001: 696 heroin treatment admissions (+87%)
- 2000: 141 heroin arrests
- 2001: 177 heroin arrests
- 2001: 12 heroin-related deaths
Historical Pricing and Purity (Early 2000s)
- Price: $20-$30 per bag
- Purity: 55-80% (far exceeding 37% national average)
Current Context
- 2020: 2,056 opiate/heroin treatment admissions
- 2019: 3,334 opiate/heroin treatment admissions
- 2009: 1,877 opiate admissions
Heroin admissions surged in the early 2000s and peaked around 2019 before declining, likely as fentanyl replaced heroin in the illicit market.
Cocaine
Historical Data
- FY2000: 310 cocaine treatment admissions
- FY2001: 298 cocaine treatment admissions (−4%)
- 2000: 134 cocaine arrests
- 2001: 208 cocaine arrests (+55%)
- 2001: 7 cocaine-related deaths
Recent Statistics
- 3.3% of population used cocaine in past year (double the 1.86% national rate)
- Vermont ranked highest in nation for cocaine use
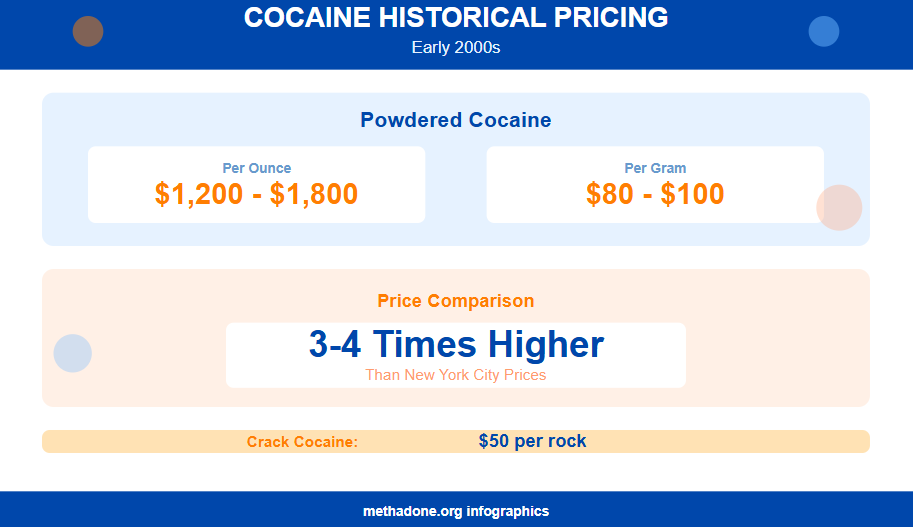
Historical Pricing (Early 2000s)
- Powdered cocaine: $1,200-$1,800 per ounce, $80-$100 per gram
- 3-4 times higher than New York City prices
- Crack cocaine: $50 per rock
Vermont has maintained high cocaine use rates for two decades, currently leading the nation.
Methamphetamine
Historical Data
- FY2000: 12 methamphetamine treatment admissions
- FY2001: 4 methamphetamine treatment admissions (−67%)
- 2007: 2 meth lab seizures
- No lab seizures since 1990 prior to 2007
Current Statistics
- 1.06% past-year use (ages 12+)
- Growing concern: Vermont health officials alarmed by shift from opioid injection to stimulant smoking (2019-2023)
- Fatal overdoses from smoking drugs more than tripled (2019-2023)
- Pipe distribution increased from 866 to 1,140 monthly (Jan-Aug 2024)
- Syringe distribution decreased from 97,364 to 52,115 monthly (same period)
While historically minimal, methamphetamine and other stimulants represent an emerging threat.
Treatment Statistics
Current Treatment Access (2022-2023)
- 5.82% of population received substance use treatment in past year
- 23.90% classified as needing treatment
- 74.86% of those needing treatment did NOT receive it
- Among youth (12-17): 58.16% of those needing treatment did not receive it
- Among young adults (18-25): 84.17% of those needing treatment did not receive it
Treatment Gap (in thousands)
- 136,000 people need treatment
- 33,000 people received treatment
- 99,000 people needing treatment did not receive it
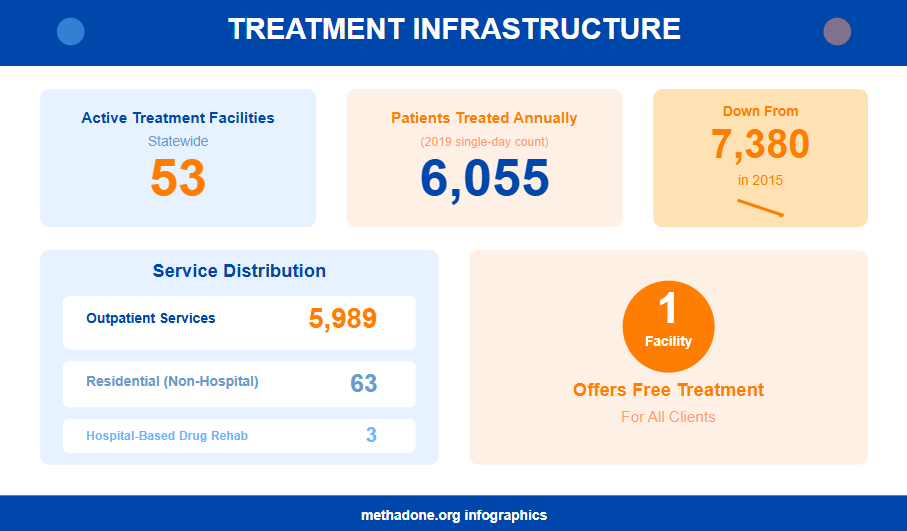
Treatment Infrastructure
- 53 active treatment facilities statewide
- 6,055 patients treated annually (2019 single-day count: down from 7,380 in 2015)
- 5,989 patients in outpatient services annually
- 63 patients in residential (non-hospital) services
- 3 patients in hospital-based drug rehab
- 1 facility offers free treatment for all clients
Treatment Focus (2019)
- 68.3% treated for drug problem only
- 11.8% treated for alcohol problem only
- 19.9% treated for both drug and alcohol problems
Historical Treatment Admissions
- 2002: 7,641 admissions
- 2008: 8,356 admissions
- 2010: 7,851 admissions
- 2010 demographics: 62.8% male, 37.1% female
Vermont faces a severe treatment gap, with three-quarters of those needing treatment not receiving it.
Medication-Assisted Treatment (MAT)
Current MAT Enrollment (2019 single-day count)
- 2,457 people receiving methadone (up from 1,624 in 2015)
- 1,705 people receiving buprenorphine (down from 2,275 in 2015)
- 32 different MAT programs available statewide
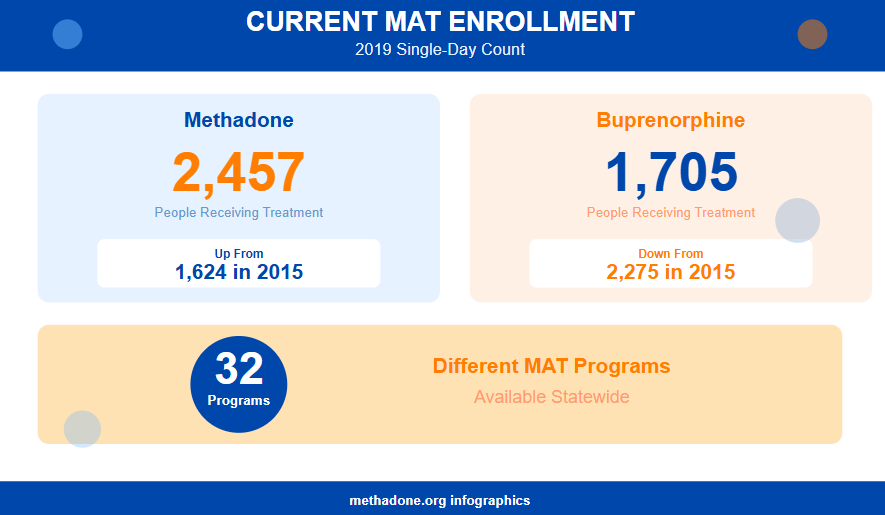
MAT access has shifted, with methadone enrollment increasing 51% while buprenorphine decreased 25%.
Treatment Costs
| Service Type | Average Cost |
| Residential (non-hospital) | $57,667 per individual |
| Outpatient | $1,543 per individual |
Spending
- Outpatient: $9.24 million (0.4% of U.S. total)
- Residential: $3.63 million (0.07% of U.S. total)
National Rankings
- Residential treatment: 34th in cost (cheapest to most expensive)
- Outpatient treatment: Top 10 cheapest states
Vermont offers relatively affordable outpatient treatment but expensive residential care.
Vermont faces a multifaceted substance abuse crisis characterized by the nation’s highest rates of illicit drug use, a devastating fentanyl-driven opioid epidemic, and a significant treatment gap. While the state has made progress in naloxone distribution and MAT access, the 92.86% increase in overdose deaths over three years demonstrates the crisis is accelerating. The emerging shift from injectable opioids to smokable stimulants represents a new challenge requiring adapted public health responses. With three-quarters of those needing treatment not receiving it, particularly among young adults, Vermont must significantly expand treatment capacity while addressing the root causes of its persistently elevated substance use rates.
Statistical Data on Alcohol in Vermont
Vermont faces significant challenges with alcohol consumption and abuse, consistently ranking among the states with the highest rates of drinking, binge drinking, and alcohol-related disorders in the nation. The state’s drinking culture affects all age groups, from minors to older adults, with concerning trends in both consumption patterns and mortality rates. This report synthesizes available data to provide a comprehensive picture of alcohol use and its consequences in Vermont.
Alcohol-Related Mortality
Total Annual Deaths and Demographics
- 332 annual deaths attributable to excessive alcohol use (earlier data)
- 439 total alcohol-attributable deaths in 2020-2021 (286 males, 153 females)
- 435 alcohol-related deaths estimated in 2021, representing a 36% increase from 2017
- Only 1.5% (1.51%) of deaths involve individuals under age 21 – among the lowest nationwide
- 88.9% of deaths occur in adults aged 35 and older
- 66.0% of deaths from excessive alcohol use are male

Vermont has experienced a dramatic rise in alcohol-related mortality, with deaths increasing 36% between 2017 and 2021.
Causes of Death (2020-2021)
| Cause | Total | Males | Females |
| Alcoholic liver disease | 79 | 53 | 26 |
| Alcohol abuse | 34 | – | – |
| Poisoning (not alcohol) | 42 | 29 | 13 |
| Motor vehicle traffic crashes | 21 | – | – |
Chronic conditions, particularly those related to Alcohol Use Disorder and liver disease, account for the majority of deaths.
Youth and Underage Drinking (Ages 12-20)
National Rankings
- Vermont leads the nation in underage binge drinking with more than 14% (14.15%) of minors engaging in this behavior
- Vermont has the highest rate of underage alcohol use nationally at 24.66% of people aged 12-20 (approximately 18,000 young people)
- 20.14% of people aged 12-20 used alcohol in the past month
- 11.50% of people aged 12-20 engaged in binge drinking in the past month
Youth Ages 12-17
- 9.56% used alcohol in the past month (7,000 youth during 2017-2019)
- 15.9% prevalence during 2017-2019 – higher than the national average of 9.4%
- 4.11% engaged in binge drinking in the past month
- 2.73% have alcohol use disorder (1,000 youth)
- 9.6% of children ages 12-17 reported drinking in the past month – Vermont ranks 50th (last) nationally on this specific metric
- 5.80% of people aged 12-20 have alcohol use disorder (4,000 individuals)
Trends
- In 2008-09, 36.5% of Vermonters aged 12-20 consumed alcohol (highest in the country)
- This decreased to 28.1% by 2016-17 (Vermont dropped to #3 nationally)
- Underage drinking has decreased across all states in recent years
Afterschool Programming Impact
- Among youth with no afterschool programming: 34% drank at least once in the past month
- With 1-9 hours of weekly programming: 31% drank at least once
- Binge drinking (10+ drinks): 6.2% with no programming, decreasing to 2.7-3.2% with programming
Despite recent declines, Vermont maintains the dubious distinction of leading the nation in underage drinking and binge drinking rates.
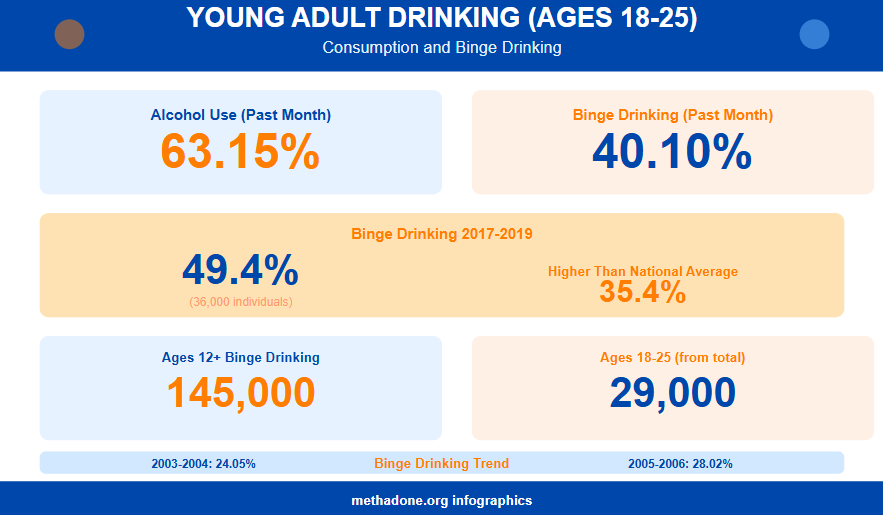
Young Adult Drinking (Ages 18-25)
Consumption and Binge Drinking
- 63.15% used alcohol in the past month
- 40.10% engaged in binge drinking in the past month
- 49.4% reported binge drinking during 2017-2019 (36,000 individuals) – higher than the national average of 35.4%
- 145,000 people aged 12+ engaged in binge drinking (with 29,000 in the 18-25 age group)
- Binge drinking increased from 24.05% in 2003-2004 to 28.02% in 2005-2006
Alcohol Use Disorder
- 18.72% of young adults aged 18-25 have alcohol use disorder (13,000 individuals)
- 14.0% prevalence during 2017-2019 (10,000 individuals) – higher than the national average of 9.8%
- This rate decreased between 2002-2004 and 2017-2019
Young adults in Vermont show exceptionally high rates of both binge drinking and alcohol use disorders, consistently exceeding both regional and national averages.
Adult Drinking Patterns
Overall Consumption Rates
- 61% of Vermont adults drink alcohol, compared to 52% nationally (nearly 20% higher than the U.S. average)
- 59.07% of people aged 12+ used alcohol in the past month
- 63.04% of adults aged 18+ used alcohol in the past month
- 54% of adults age 65+ report drinking alcohol
- Vermont ranks in the top 10 states nationally for per capita alcohol consumption
Binge Drinking Prevalence
- 18.5% of Vermont adults over 18 binge drink at least once per month
- 25.43% of people aged 12+ engaged in binge drinking in the past month
- 27.15% of adults aged 18+ engaged in binge drinking in the past month
- 27% of Vermonters acknowledged having five or more drinks (men) or four or more drinks (women) within a couple of hours
- Vermont ranks #2 nationally for binge drinking
- Median number of drinks per binge: 5.5
- The 25% most active drinkers consume a median of 7.5 drinks per binge
- Binge drinking adults binge a median of 1.9 times monthly
- The 25% most active drinkers binge 4.3 times per month

Heavy Drinking
- 10% of Vermont adults report heavy drinking (more than two drinks daily for men, more than one for women), compared to 7% nationally
- 17.7% of adults reported excessive drinking (binge or heavy drinking) – Vermont ranks 33rd nationally on this measure
Vermont’s drinking rates significantly exceed national averages across all metrics.
Older Adult Drinking (Age 65+)
- 25% report at-risk drinking, significantly higher than the U.S. average of 20%
- 6% report chronic drinking, significantly higher than the U.S. average of 4%
- At-risk drinking is lower among older adults with disabilities (20% vs. 29%), low-income individuals (17% vs. 36%), those with high school education or less (18% vs. 29%), and BIPOC individuals (10% vs. 26%)
- Older adults with diabetes are significantly less likely to engage in at-risk drinking (14% vs. 27%) or chronic drinking (1% vs. 7%)
Vermont’s older adults show significantly elevated rates of problematic drinking compared to national peers, with one in four engaging in at-risk drinking behaviors.
Alcohol Use Disorder
Prevalence Rates
- 11.14% of people aged 12+ have alcohol use disorder
- 11.81% of adults aged 18+ have alcohol use disorder
- Approximately 12% of Vermont adults (66,000 people) have a diagnosable alcohol use disorder
- 63,000 people aged 12+ have alcohol use disorder (2022-2023 average)
- 62,000 adults aged 18+ have alcohol use disorder
- 7.5% prevalence of past-year alcohol use disorder among people aged 12+ (2017-2019), higher than the national average of 5.3%

Vermont consistently ranks in the top 10 states for the share of residents with diagnosable alcohol use disorders.
Risk Perceptions
- 36.76% of people aged 12+ perceive great risk from having 5+ drinks once or twice weekly
- 37.07% of adults aged 18+ perceive great risk from this behavior
- 32.88% of youth aged 12-17 perceive great risk
- 29.62% of young adults aged 18-25 perceive great risk (lowest of all age groups)
- 32.86% of people aged 12-20 perceive great risk
Vermont residents show relatively low perception of risk from frequent heavy drinking, particularly among young adults.
Treatment Statistics (2010)
- 2,123 people admitted for alcohol as primary substance of abuse
- 1,672 people treated for alcohol in combination with a secondary drug
- Largest age groups suffering from primary alcohol abuse: 46-50 year olds, followed by 41-45 year olds
The 2010 treatment data reveals that nearly 3,800 Vermonters sought addiction treatment involving alcohol, with over half requiring treatment for alcohol combined with other substances, indicating complex polysubstance abuse patterns.
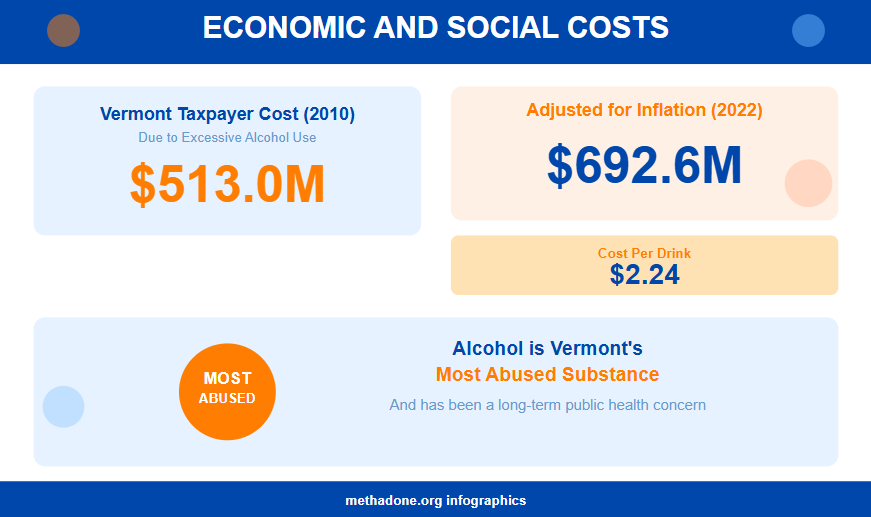
Economic and Social Costs
- Vermont taxpayers spent $513.0 million due to excessive alcohol use in 2010
- Adjusted for inflation: $692.6 million or $2.24 per drink in 2022 dollars
- Alcohol is Vermont’s most abused substance and has been a long-term public health concern
The financial burden of alcohol abuse extends far beyond individual health costs, affecting Vermont’s entire taxpayer base through healthcare expenses, lost productivity, law enforcement, and social services.
Vermont faces a serious and escalating alcohol crisis that affects residents across all age groups, with the state consistently ranking among the nation’s leaders in drinking, binge drinking, and alcohol use disorders. The 36% increase in alcohol-related deaths between 2017 and 2021, combined with rates showing 61% of adults drinking and 66,000 Vermonters suffering from diagnosable alcohol use disorders, demonstrates the urgent need for comprehensive intervention strategies. While there are encouraging signs, such as declining underage drinking rates and the positive impact of afterschool programming on youth, the overall picture remains deeply concerning, with Vermont leading the nation in underage drinking and binge drinking while bearing nearly $700 million in annual economic costs. Addressing this public health emergency will require coordinated efforts in prevention, education, treatment accessibility, and cultural change to reduce the normalization of excessive alcohol consumption that permeates Vermont society.
Conclusion
In general, Vermont faces a dual substance abuse crisis of alarming proportions, ranking among the nation’s worst for both illicit drug use and alcohol consumption. The state has seen overdose deaths nearly quadruple since 2009, with fentanyl now driving 95% of opioid fatalities, while simultaneously leading the nation in underage drinking and binge drinking rates. With over 20% of residents suffering from substance use disorders and three-quarters of those needing treatment unable to access it, Vermont confronts a critical treatment capacity gap that costs taxpayers nearly $700 million annually in alcohol-related expenses alone. The escalating crisis—evidenced by a 36% increase in alcohol deaths and 93% surge in drug overdose deaths over recent years—demands urgent, comprehensive intervention addressing both the Supply of increasingly dangerous drugs and the underlying factors driving Vermont’s persistently elevated substance use rates.
Sources:
- Drug Abuse StatisticsVERMONT DRUG CONTROL UPDATE
- Drug Use Trends in Vermont Substance Abuse Treatment Admissions Data
- VERMONT – National Survey on Drug Use and Health
- VERMONT DRUG CONTROL UPDATE Drug Use Trends in Vermont Substance Abuse Treatment Admissions Datat_0.pdf
- Explore Illicit Drug Use – Youth in Vermont | AHR
- These States Have the Highest Rates of Illicit Drug Use – Newsweek
- Vermont health officials alarmed by shift from opioid abuse to stimulants
- The State of the Opioid Crisis in Vermont Today
- Vermont Drug Statistics, Vermonth Drug Use Statistics | Recovery Connection
- Drug Use by State: 2020’s Problem Areas – WalletHub Study
- Behavioral Health Barometer: Vermont, Volume 6
- Vermont Drug Threat Assessment Update
- VERMONT DRUG CONTROL UPDATE Drug Use Trends in Vermont Substance Abuse Treatment Admissions Data
- Binge drinking, alcohol use disorder in Vermont ranked among the highest in the nation – VTDigger
- Explore Excessive Drinking in Vermont | AHR
- Vermont has a drinking problem. It’s time to talk about it
- ARDI Alcohol-Attributable Deaths, VT | CDC
- Vermont Has a Drinking Problem. It’s Time to Talk About It. | Seven Days
- Alcohol Use Among Older Adults
- States with Highest Use of Alcohol Among Minors- Vermont, Rhode Island, New Hampshire – OnFocus
- Explore Alcohol Use – Youth in Vermont | AHR
- Alcohol consumption and binge drinking among VT high school students and afterschool participation