Statistical Data on Drugs in Oregon
Oregon faces significant challenges with substance use disorders and ranks among the highest states for drug use across multiple categories. This statement is based on the results of various surveys and drug testing methods, including hair tests. The state has seen a concerning upward trend in drug use and overdose deaths, particularly with opioids and methamphetamine, while simultaneously struggling with treatment accessibility issues.
Overdose Statistics
Recent Trends
- 2023: Over 1,800 drug overdose deaths
- 2019: 626 overdose deaths
- 2023: 11,125 emergency room visits due to drug overdoses
- 2023: Nearly 1,400 opioid overdose deaths

Overdose deaths have shown a dramatic increase since 2019, with opioids being responsible for the majority of fatalities.
Death Rate Comparisons (per 100,000 population)
| Year | Oregon Rate | National Rate |
| 2009 | 15.1 | 12.8 |
| 2011 | 13.5 | 13.2 |
| 2021 | 26.8 | 32.4 |
Regional Comparison (Deaths per 100,000)
| State | Opioid Death Rate |
| Oregon | 18.7 |
| Washington | 14.5 |
| Idaho | 12.1 |
| National Avg | 15.0 |
Oregon’s opioid death rate exceeds both neighboring states and the national average, indicating a particularly severe opioid crisis in the state.
Opioid-Specific Statistics
- 2021: 779 opioid overdose deaths (67% of all drug overdose deaths)
- Weekly prescription opioid overdose deaths: 3
- Prescription opioids involved in 44.5% of opioid overdose deaths
- Heroin involved in 45.4% of deaths
- Synthetic opioids were involved in 28.6% of deaths
Fentanyl Impact
| Year | Fentanyl Deaths |
| 2019 | 75 |
| 2020 | 298 |
| 2022 | 90% of opioid fatalities |
Overdose deaths show a concerning upward trend, with opioids and especially fentanyl playing a major role in fatalities.
Comparative Death Statistics (2007)
| Cause of Death | Number |
| Drug Use | 564 |
| Motor Vehicle | 490 |
| Firearms | 387 |
Drug-related deaths have consistently exceeded other common causes of mortality, with a dramatic increase in recent years.
General Drug Use Statistics
Overall Drug Use Rates (2020-2022)
- Past-month illicit drug use: 24.03% of population aged 12+
- Past-year marijuana use: 31.22% of population aged 12+
- Past-month marijuana use: 21.84% of population aged 12+
- Illicit drug use other than marijuana: 4.41% of population aged 12+
Oregon’s drug use rates significantly exceed national averages, with particularly high rates of marijuana use. The use of hair follicle drug test shampoos is also high for obvious reasons. The state ranks among the top in the nation for several drug use categories.
Historical Trend of Past-Month Illicit Drug Use
| Year | Oregon Rate | National Average |
| 2001 | 7.50% | 5.90% |
| 2010 | 9.20% | 7.80% |
| 2020 | 12.63% | 8.82% |
The data shows a consistent upward trend in illicit drug use in Oregon, with the gap between state and national averages widening over time.
Marijuana Use Trends (2017-2019)
| Population Group | Oregon Rate | National Average |
| Youth (12-17) | 10.4% | 6.8% |
| Young Adults (18-25) | 49.4% | 35.0% |
| Overall Population | 27.7% | 16.2% |
Oregon’s marijuana use rates significantly exceed national averages across all age groups. Local inhabitants also commonly use various THC detox methods at home.
Regional Rankings
- Highest state for illicit drug use disorder (9.04%)
- Second highest for past-month marijuana use (19.26%)
- First for methamphetamine use (1.93%)
- Seventh for cocaine use (2.37%)
- First for prescription opioid misuse (4.46%)
Oregon consistently ranks at or near the top for multiple substance use categories, indicating a widespread and severe substance use problem across the state. Thus, it comes as no Surprise that many of local inhabitants constantly look for the best way to pass a drug test.
Detailed Drug Use Statistics (2021-2022)
Population Numbers (in Thousands) by Substance
| Substance/Category | Total (12+) | Youth (12-17) | Young Adults (18-25) | Adults (26+) |
| Past Month Illicit Drugs | 880 | 29 | 160 | 691 |
| Past Year Marijuana | 1,144 | 43 | 212 | 889 |
| Past Month Marijuana | 800 | 27 | 146 | 627 |
| Past Year Cocaine | 74 | 0 | 20 | 54 |
| Past Year Hallucinogens | 206 | 8 | 60 | 138 |
| Past Year Methamphetamine | 43 | 0 | 2 | 41 |
| Past Year Pain Reliever Misuse | 140 | 6 | 18 | 116 |
| Past Year Opioid Misuse | 134 | 6 | 19 | 109 |
Adult population represents the largest number of users across all substances.
General Population Statistics (12+ years)
Substance Use Disorder (SUD) Statistics 2021-2022
- Overall SUD rate: 21.85%
- Drug use disorder: 11.58%
- Pain reliever use disorder: 1.55%
- Opioid use disorder: 1.84%
These rates indicate that over one-fifth of Oregon’s population struggles with substance use disorders, significantly higher than national averages.
Teen Substance Use Comparisons
- 11.46% of teens (34,000) used drugs in past month
- 94.12% of teen users report marijuana use
- 18.54% used marijuana in past year
Other substance use among teens:
- Cocaine: 0.67%
- Methamphetamines: 0.34%
- Heroin: 0.17%
- Pain relievers misuse: 3.03%
Oregon teens are 37.62% more likely to use drugs than the national average, with marijuana being the predominant substance.
Youth Drug Use
Substance Use Rates
- Substance use disorder: 12.52%
- Drug use disorder: 9.24%
- Pain reliever use disorder: 0.94%
- Opioid use disorder: 0.94%
Current Statistics
- Illicit drug use (past month): 9.46%
- Marijuana use (past year): 13.96%
- Marijuana use (past month): 8.93%
- Cocaine use (past year): 0.14%
- Prescription pain reliever misuse (past year): 1.87%
Youth drug use in Oregon remains a significant concern, with rates consistently higher than national averages. Marijuana is the most commonly used substance among youth.
Young Adult Statistics (Ages 18-25)
Detailed Substance Use Rates
- Substance use disorder: 35.69%
- Drug use disorder: 25.05%
- Pain reliever use disorder: 1.28%
- Opioid use disorder: 1.34%
- Past-year marijuana use: 51.12%
- Past-month marijuana use: 35.24%
- Past-month illicit drug use: 38.61%
- Cocaine use (past year): 4.90%
- Hallucinogen use (past year): 14.51%
Young adults show the highest rates of substance use disorders among all age groups, with particularly high rates of marijuana and illicit drug use. it’s also troubling that they engage in at-home detox without any supervision.
Adult Statistics (26+)
Usage Rates
- Past-month illicit drug use: 23.49%
- Past-year marijuana use: 30.20%
- Past-month marijuana use: 21.29%
- Cocaine use (past year): 1.82%
- Hallucinogen use (past year): 4.69%
- Methamphetamine use (past year): 1.39%
Adult usage rates remain high across multiple substances, particularly for marijuana use. Additionally, many adult use special detox shampoos to pass hair drug tests at work.
Substance Use Risk Analysis (2021-2022)
Risk Perception by Age (Percentages)
| Risk Category | Overall | 12-17 | 18-25 | 26+ |
| Monthly Marijuana | 14.26% | 12.33% | 7.63% | 15.41% |
| Monthly Cocaine | 56.23% | 46.30% | 50.43% | 58.09% |
| Trying Heroin | 78.19% | 53.43% | 74.52% | 81.24% |
Risk perception increases with age for most substances, with heroin perceived as most dangerous.
Treatment Statistics
Medication-Assisted Treatment (2019)
- Methadone treatment: 5,146 people
- Buprenorphine treatment: 1,976 people
- Increase in buprenorphine treatment since 2015: from 601 to 1,976 people
Treatment Facilities
- Active substance abuse clinics: 265
- Annual clients treated: 20,268
- Free treatment facilities: 1
Historical Facility Count
| Year | Number of Facilities |
| 2002 | 232 |
| 2006 | 224 |
| Current | 265 |
Treatment modalities (2019)
- Outpatient services: 19,520 clients annually
- Residential services: 705 clients
- Hospital-based: 43 clients
Treatment Access by Age Group (2022)
| Age Group | Received Treatment | Needed Treatment | Treatment Gap |
| 12+ | 5.25% | 23.54% | 79.09% |
| 12-17 | 4.77% | 13.52% | * |
| 18-25 | 6.38% | 39.46% | 83.05% |
| 26+ | 5.13% | 22.28% | 79.16% |
Oregon ranks last nationwide in treatment accessibility, with a significant gap between those needing and receiving treatment. Cost remains a major barrier to accessing care. This is also one of the reasons why THC detox kits are so popular among marijuana users in the state.
Most Commonly Abused Substances (Treatment Admissions Data)
Primary Substances
- Marijuana: 8,014 treatment admissions (40.9% were ages 12-17)
- Amphetamines: 6,558 admissions (highest among ages 26-30)
- Heroin: 4,218 admissions (62.3% male, 37.7% female)
- Prescription drugs: 2,408 admissions for opiates (excluding heroin)
Marijuana leads treatment admissions, particularly among youth, while amphetamine and heroin use show concerning rates among adults.
Economic Impact and Costs
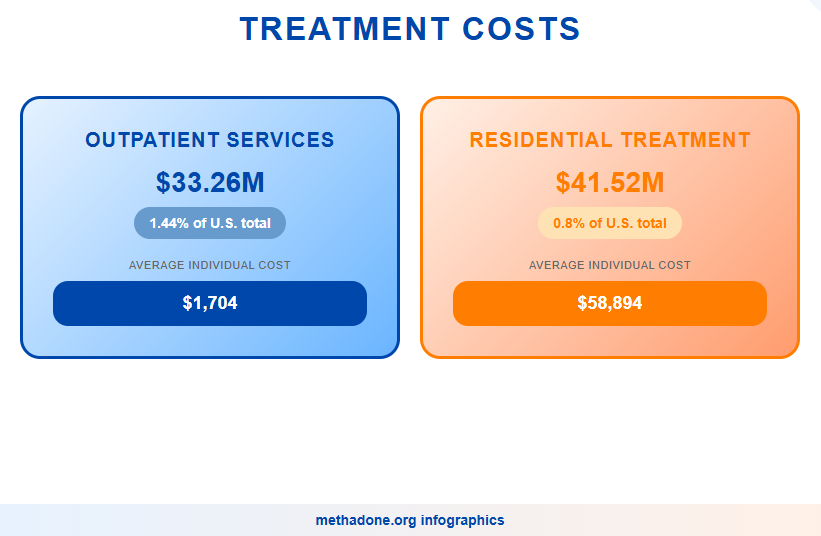
Treatment Costs
- Outpatient services: $33.26 million (1.44% of U.S. total)
- Residential treatment: $41.52 million (0.8% of U.S. total)
- Average individual outpatient cost: $1,704
- Average individual residential cost: $58,894
Healthcare Impact
- Hepatitis C cases from IV drug use: 48,700
- HIV/AIDS cases from IV drug use: 6,879
- Neonatal Opioid Withdrawal syndrome: 0.62% of hospital births
The economic burden of substance use disorders in Oregon is substantial, with high individual treatment costs potentially creating barriers to access.
Prescription Statistics
- Doctors write prescriptions for 57.3% of residents
- 54% of all prescriptions were for opioids
The high rate of opioid prescriptions may contribute to the state’s significant opioid abuse problems.
Oregon’s drug crisis has reached critical levels, with overdose deaths tripling to over 1,800 in 2023 and the state ranking first nationally for illicit drug use disorder at 9.04%. With an overall substance use disorder rate of 21.85% but only 20% of those needing treatment receiving it, Oregon faces an urgent public health emergency requiring immediate intervention.
Statistical Data on Alcohol in Oregon
Oregon faces significant challenges with alcohol use, ranking among the top states for consumption and related disorders. As the third leading cause of preventable death in the state, alcohol abuse presents a major public health concern with substantial economic and social impacts.
Mortality and Health Impact
Death Statistics
- Annual alcohol-related deaths: 2,186
- Deaths under age 21: 2.0% (43 deaths)
- Male deaths: 68.1%
- Deaths aged 35+: 89.3%
- Daily deaths (2022): 6 (40% increase from 2019)
- Years of potential life lost annually: 50,830
- Years of potential life lost (under 21): 2,396
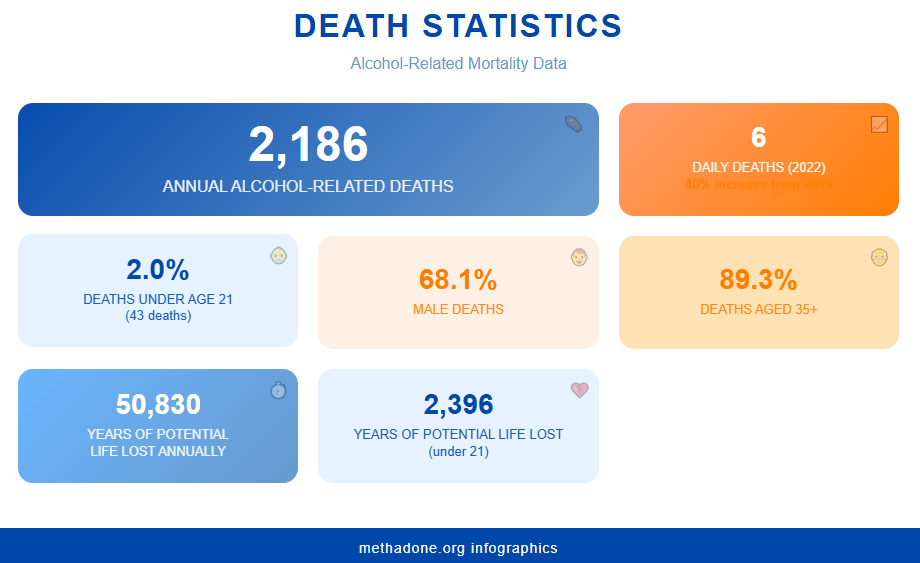
Alcohol-related deaths predominantly affect older adult males, with a concerning recent increase in daily fatalities.
Binge Drinking Patterns
- Adults who binge drink: 17.0%
- Median drinks per binge: 5.5
- Top 25% drinkers median drinks: 7.4
- Median binge episodes monthly: 1.7
- Top 25% monthly episodes: 4.1
While the median binge drinking frequency is moderate, the most active drinkers show significantly higher consumption patterns.
General Population Statistics (2021-2022)
Total Population Numbers (in thousands)
| Category | 12+ years | 12-17 | 18-25 | 26+ | 18+ |
| Alcohol Use Past Month | 1,981 | 26 | 229 | 1,726 | 1,955 |
| Binge Alcohol Use | 818 | 12 | 136 | 670 | 807 |
| Risk Perception* | 1,485 | 113 | 141 | 1,231 | 1,373 |
*People perceiving great risk from having 5+ drinks once or twice per week
Percentage Breakdown
| Category | 12+ years | 12-17 | 18-25 | 26+ | 18+ |
| Alcohol Use Past Month | 54.05% | 8.50% | 55.25% | 58.63% | 58.22% |
| Binge Alcohol Use | 22.33% | 3.78% | 32.93% | 22.77% | 24.03% |
| Risk Perception | 40.54% | 36.86% | 34.11% | 41.83% | 40.87% |
| Alcohol Use Disorder | 12.23% | 4.37% | 17.64% | 12.29% | 12.95% |
The data shows a clear age-related pattern in alcohol use and risk perception, with young adults (18-25) showing particularly high rates of use and lower risk perception compared to other age groups.
Underage Drinking Details (Ages 12-20)
Current Usage (2022)
| Metric | Number | Percentage |
| Total Past-Month Use | 96,000 | 21.1% |
| Total Binge Use | 58,000 | 12.8% |
Age-Specific Breakdown
| Age Group | Past-Month Use | Binge Use |
| 12-14 | 5,000 (3.5%) | 3,000 (2.6%) |
| 15-17 | 29,000 (18%) | 14,000 (8.4%) |
| 18-20 | 62,000 (38.8%) | 41,000 (25.8%) |
Additional Youth Statistics
- Average initiation age: 15.7 years
- Fatal crashes (15-20 year drivers with BAC > 0.01%): 22 (29% of all fatal crashes)
The data reveals a clear progression in alcohol use through adolescence, with significant jumps in both use and binge drinking rates as teens approach legal drinking age.
Geographic and Regional Patterns
County-Level Statistics
- Counties with excessive drinking rates below 20%: 9 out of 36
- Lowest rate: Marion County (17%)
- Overall state excessive drinking rate: 16.7% (Ranks 25th nationally)
- Adult excessive drinking rate: 20%
Regional Comparisons (2017-2019)
Young Adults (18-25):
- Oregon binge drinking: 38.9%
- Regional average: 33.4%
- National average: 35.4%
Adults (21+):
- Past-Month Use: 63.4%
- Past-Month Binge Use: 24.4%
The geographic data shows that excessive drinking is a widespread issue across Oregon, with most counties showing rates above 20%, indicating a pervasive public health challenge throughout the state.
State Rankings and Trends
- Alcohol Use (Past Month): 10th in U.S.
- Alcohol Use Disorder: 5th in U.S.
- Per capita consumption: 15th highest in U.S.
- Annual consumption: 2.8 gallons per person (587 drinks/person)
Alcohol Use Disorder Rates
| Age Group | Rate |
| 12+ years | 12.23% |
| 12-17 years | 4.37% |
| 18-25 years | 17.64% |
| 26+ years | 12.29% |
Oregon consistently ranks high in alcohol use and related disorders, with young adults showing the highest disorder rates.
Economic Impact and Industry
Costs
- Annual cost to taxpayers (2022): $4.752 billion (2010 cost: $3.520 billion; inflation-adjusted increase: $1.232 billion)
- Cost per drink (2022): $2.81
- Cost per person: $1,100
Industry Marketing
- National advertising spending: $3.5 billion
- Retail environment advertising: 29% of total
The economic burden of alcohol use in Oregon shows significant growth over time, with substantial costs to both the state and individual taxpayers.
Risk Perception
Percentage perceiving great risk from having 5+ drinks once/twice weekly:
- Overall (12+): 40.54%
- Youth (12-17): 36.86%
- Young Adults (18-25): 34.11%
- Adults (26+): 41.83%
Risk perception is notably lower among young adults, which may contribute to higher rates of dangerous drinking behaviors in this age group.
Treatment Statistics (2010)
- Primary alcohol treatment: 14,729 people
- Combined alcohol/drug treatment: 10,189 people
- Total treatment cases: 24,918
A significant number of individuals seek treatment for alcohol use, often in combination with other substances.
Oregon’s alcohol crisis has reached critical levels, with six daily deaths in 2022 (40% increase from 2019) and 54% of adults reporting past-month use. With young adults showing alarming rates of disorders (17.64%) and binge drinking (32.93%), and an annual economic impact of $4.752 billion, the state faces an urgent public health emergency requiring immediate intervention.
In general, Oregon faces a devastating dual crisis of drug and alcohol abuse. Drug overdose deaths have tripled to over 1,800 in 2023, while alcohol claims six lives daily (a 40% increase since 2019). The state ranks first nationally for illicit drug use disorder (9.04%) and fifth for alcohol use disorder, with over half of adults reporting past-month alcohol use. Young adults show particularly alarming rates, with 35.69% experiencing substance use disorders and 32.93% engaging in binge drinking. With combined economic impacts exceeding $4.752 billion annually and a severe treatment gap where 80% of those needing help don’t receive it, Oregon faces an unprecedented public health emergency requiring immediate, comprehensive intervention.
Sources:
- Drug Abuse Statistics
- OREGON DRUG CONTROL UPDATE Drug Use Trends in Oregon
- Oregon Data extracted from the National Survey on Drug Use and Health, released December 2021
- OREGON – National Survey on Drug Use and Health: 2021-2022
- Mental Health and Substance Use State Fact Sheets: Oregon | KFF
- Oregon – Substance Abuse Statistics by State
- Fatal drug overdoses in Oregon reached record levels in 2023
- The Latest Drug Addiction Statistics in Oregon
- Behavioral Health Barometer: Oregon, Volume 6
- Alcohol is third-leading cause of preventable death in Oregon
- Binge Drinking Among Adults in Oregon
- Oregon 2022 State Report – Underage Drinking Prevention and Enforcement
- Alcohol consumption among adults and youth in Oregon
- Map: These Oregon counties are home to the most excessive drinkers, study finds | KOIN.com
- Explore Excessive Drinking in Oregon | AHR