Statistical Data on Drugs in Oklahoma
Oklahoma faces significant challenges with substance abuse and addiction, with particularly concerning trends in methamphetamine use and overdose deaths. The state has seen dramatic increases in certain drug-related incidents while making progress in others, such as prescription opioid deaths. This analysis compiles key statistics from various years to provide a comprehensive overview of the drug situation in Oklahoma.
Overdose Deaths and Mortality
- Total overdose deaths (2023): Over 1,200
- Methamphetamine-related deaths (2023): 732 (41% involved an opioid)
- Drug-induced deaths rate: 20.8 per 100,000 population (exceeded national rate of 12.8 per 100,000)
- Methamphetamine deaths trend: Increased from 39 in 2007 to 813 in 2023 (21-fold increase)
- Fentanyl deaths trend: Increased from 50 in 2019 to 730 in 2023 (15-fold increase)
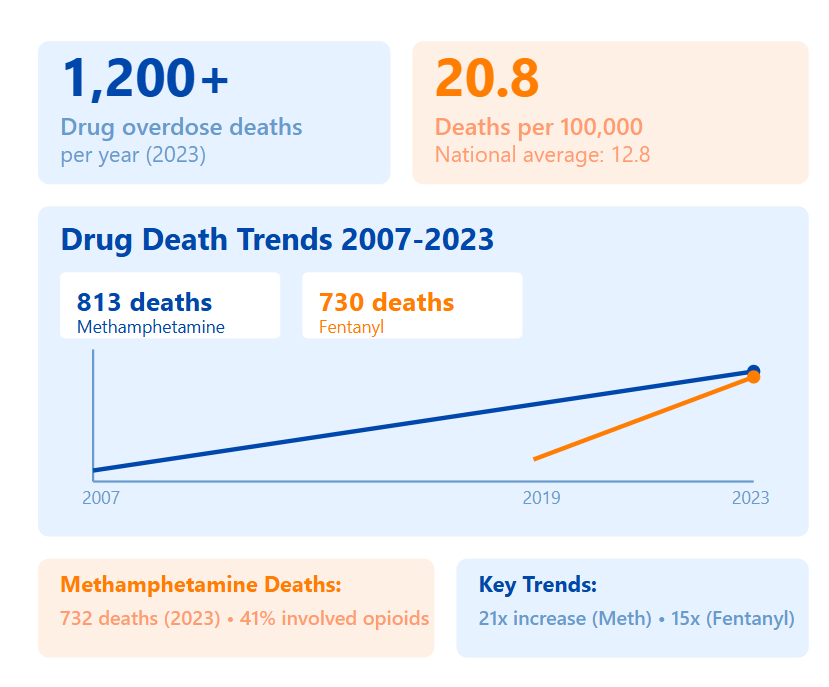
The data shows a dramatic increase in drug-related deaths, particularly from methamphetamine and fentanyl. The sharp rise in fentanyl deaths (90% of opioid-related deaths in 2023) represents a significant shift from pre-2020 patterns.
Historical Trends
Drug overdose death rates:
- 2011: 18.9 per 100,000
- 2021: 24.4 per 100,000
National comparison:
- 2011: 13.2 per 100,000
- 2021: 32.4 per 100,000
Unintentional drug overdose deaths:
- 2016-2019: 20% decrease
- 2019-2023: 129% increase
While Oklahoma’s death rate increase has been less severe than the national trend, the recent sharp increase since 2019 indicates a worsening crisis.
2021 Drug-Specific Death Statistics
| Drug | Number of Deaths |
| Oxycodone | 43 |
| Fentanyl | 299 |
| Methamphetamine | 603 |
| Total opioid overdoses | 468 |
The 2021 data shows a shift in the drug landscape, with methamphetamine becoming the leading cause of drug-related deaths, followed by fentanyl. The relatively lower number of oxycodone deaths may reflect successful efforts to control prescription opioid abuse, but the high fentanyl numbers suggest a dangerous transition to more potent synthetic opioids.
Death Cause Comparison
| Cause | Number of Deaths |
| Drug-induced | 766 |
| Motor vehicle accidents | 736 |
| Firearms | 533 |
This indicates that drug use is a significant public health concern, exceeding other major causes of mortality in the state.
Opioid Statistics (2017)
- Total deaths: 388
- Death rate: 10.2 per 100,000 (vs national: 14.6 per 100,000)
Opioid Death Breakdown
| Type | Number of Deaths |
| Prescription opioids | 251 |
| Synthetic opioids | 102 |
| Heroin | 61 |
While Oklahoma’s opioid death rate was lower than the national average, prescription opioids were responsible for the majority of opioid-related deaths, suggesting a significant problem with prescription drug misuse rather than illicit opioids like heroin.
Rankings and Comparisons
- Ranks 2nd in the nation for highest rate of substance abuse disorders
- 5th cheapest state for residential rehabilitation services
- Drug overdose death rate is 19.32% lower than the national average
- Accounts for 0.92% of nationwide overdose deaths
- Methamphetamine usage rate (1.6%) is nearly twice the national rate
While Oklahoma shows better than average statistics in some areas, such as overdose deaths, it faces significant challenges as indicated by its high ranking in substance abuse disorders.
Detailed Population Drug Use Statistics
Youth Drug Use (Ages 12-17)
- Total drug users in past month: 24,000 (7.49%)
- Marijuana use in past month: 79.17% of drug users
- Marijuana use in past year: 11.23%
- Pain reliever misuse: 2.81%
- Cocaine use: 0.31%
- Methamphetamine use: 0.31%
- Heroin use: Up to 0.16%
Marijuana represents the most commonly used substance among youth, while harder drugs show lower but concerning usage rates. It’s also worth mentioning that the number of young people looking for the best way to pass a drug test through questionable means also continues to icnrease.
Young Adult Drug Use (Ages 18-25)
- Past month drug use: 134,000 users
- Marijuana use (2017-2019) (past year use: 32.5% (136,000 people); marijuana use disorder: 3.6% (15,000 people))
- Opioid use disorder: 2.0% (8,000 people)
- Illicit drug use disorder: 7.2% (30,000 people)
- Substance use disorder: 15.2% (64,000 people)
Adult Population (12+ years)
- Past month illicit drug use: 12.11%
- Past year marijuana use: 15.37%
- Past month marijuana use: 10.07%
- Past year cocaine use: 1.63%
- Past year heroin use: 0.27%
- Past year methamphetamine use: 1.19%
- Past year pain reliever misuse: 3.89%
Young adults show significantly higher rates of substance use compared to both adolescents and older adults, suggesting this age group may need targeted intervention strategies. It’s also worth mentioning that various THC detox kits are extremely popular among young adults who consume merijuana.
Prescription Drug Statistics
Opioid prescriptions (2017):
- 88.1 per 100 persons
- 30% decline from 2012 (127 prescriptions per 100 persons)
Opioid-related overdose deaths:
- 2012: 11.8 deaths per 100,000
- 2017: 6.7 deaths per 100,000
Neonatal Abstinence Syndrome: 0.68% of hospital births
While prescription rates and related deaths have declined, the impact on newborns indicates ongoing concerns with maternal substance use.
Methamphetamine Trends
- Usage rate: 1.6% (nearly twice the national rate)
- Treatment admissions increase: 70% since 2012
- Primary drug treatment admissions increase: 88% since 2012
- Meth lab seizures: Increased 440% from 184 (2008) to 993 (2011)
Methamphetamine represents a growing crisis in Oklahoma, with significant increases in both usage rates and treatment needs. Many people also use a drug detox shampoo to prepare for drug testing at work or various legal situations.
Risk Perception Statistics (2018-2019)
Perceived Risk by Drug (Population 12+)
| Drug | Percentage Perceiving Risk |
| Monthly marijuana use | 22.56% |
| Monthly cocaine use | 72.56% |
| Trying heroin | 85.10% |
Marijuana Risk Perception by Age Group
| Age Group | Percentage Perceiving Risk |
| Ages 12-17 | 19.98% |
| Ages 18-25 | 10.95% |
| Ages 26+ | 24.85% |
There’s a clear hierarchy in risk perception, with heroin viewed as most dangerous, followed by cocaine, while marijuana use is perceived as relatively low-risk. The particularly low risk perception of marijuana among young adults (18-25) could contribute to higher usage rates in this age group. It’s also commonly believed that at-home THC detox kits can help with removing weed from the body.
Harm Reduction Statistics (2022-2024)
- Total clients served: 8,896
- Syringes distributed: 578,330
- Fentanyl test strips distributed: 23,532
- Naloxone kits distributed: 25,125
- Reported overdose reversals: 1,212
The harm reduction program shows significant reach and impact, particularly in preventing overdose deaths through naloxone distribution.
Substance Use Disorders and Treatment Patterns
- Adults with substance use disorder: 584,000 (approximately 1 in 5 adults)
- Young adults (18-25) with substance use disorder: 15.2%
- Total population with substance use disorder: 8.3%
Treatment facility trends:
- 2002: 146 facilities
- 2006: 176 facilities
Co-occurring disorders in treatment admissions:
- 1992: 17.8%
- 2006: 32%
Treatment admission demographics (2009):
- Marijuana: 3,675 admissions (22.1% aged 21-25)
- Cocaine smoking: 817 admissions
- Cocaine (other methods): 309 admissions
- Amphetamines: 2,965 admissions
- Opiates (non-heroin): 1,533 admissions (51.8% male, 48.2% female)
The data shows a significant increase in co-occurring disorders over time, suggesting a growing complexity in treatment needs. The variety of substances requiring treatment indicates the need for diverse treatment approaches. It’s also troubing that some individuals use special detox shampoos to pass hair tests, especially in the work environment.
Treatment Statistics
| Category | Number |
| Active substance abuse clinics | 218 |
| Annual clients treated | 23,332 |
| Outpatient services clients | 22,233 |
| Residential treatment clients | 1,048 |
| Hospital rehabilitation clients | 51 |
| Facilities offering free treatment | 10 |
The treatment infrastructure shows a heavy emphasis on outpatient services, with limited residential and hospital-based treatment options. In this context, it’s unsurprising that many individuals wonder how to pass a hair follicle test with the help of commercial detox products.
Cost of Treatment
| Service Type | Average Individual Cost |
| Residential rehabilitation | $54,475 |
| Outpatient services | $1,704 |
There is a significant cost disparity between residential and outpatient treatment, which may impact accessibility to intensive care options.
Treatment Needs (2018-2019)
People Needing But Not Receiving Treatment
- Illicit drug use: 79,000 people (2.43%)
- Any substance use: 229,000 people (7.08%)
Treatment Gap by Age Group
| Age Group | Number of People | Percentage |
| Ages 12-17 | 13,000 | 4.10% |
| Ages 18-25 | 57,000 | 13.67% |
| Ages 26+ | 159,000 | 6.36% |
A significant treatment gap exists across all age groups, with young adults showing the highest unmet need at 13.67%. The large number of people needing but not receiving treatment (229,000) suggests substantial barriers to accessing treatment services.
Health Impact Statistics
HIV and Hepatitis C Statistics
HIV cases (2015): 5,774 diagnosed cases
- Rate: 179 cases per 100,000 persons
- Male cases attributed to IDU: 18.6%
- Female cases attributed to IDU: 26.3%
New HIV cases (2016): 293
- Male cases attributed to IDU: 16.6%
- Female cases attributed to IDU: 13.5%
Hepatitis C:
- Living with HCV: 53,900 cases (2013-2016 average)
- Rate: 1,840.0 cases per 100,000 persons
- Acute cases (2016): 32 (0.8 per 100,000)
- IDU-related cases: 62.5%
The high percentage of HIV and HCV cases attributed to injection drug use highlights the significant public health impact of substance use disorders.
Oklahoma faces a severe drug crisis, characterized by a dramatic shift from prescription opioids to methamphetamine and fentanyl, with meth deaths increasing 21-fold since 2007 and fentanyl deaths rising 15-fold since 2019. Despite progress in reducing prescription opioid deaths, significant treatment gaps persist, with 229,000 people needing but not receiving treatment, while one in five Oklahoma adults struggles with substance use disorder. The combination of high treatment costs, limited accessibility, and rising death rates highlights the urgent need for enhanced drug prevention and treatment strategies.
Statistical Data on Alcohol in Oklahoma
Oklahoma faces significant challenges with alcohol abuse and its consequences, ranking among the top states for alcohol-related deaths and showing concerning trends in both adult and youth consumption patterns. The state has experienced substantial economic impact from alcohol abuse, with notable effects on public health, workplace productivity, and social welfare.
Death Statistics
State ranking for alcohol-related mortality: 6th nationally
Demographic breakdown of deaths:
- 68.6% male
- 85% aged 35 years and older
- 2.76% under age 21
- 58.7% of deaths are from chronic causes (e.g., Alcohol Use Disorder)
- Years of potential life lost annually: 54,217
The mortality data shows a disproportionate impact on males and older adults, with chronic conditions being the primary cause of death. The high ranking in national mortality rates indicates this is a critical public health issue for the state.
Consumption Patterns
Adult Consumption
| Metric | Percentage/Value |
| Adults who binge drink monthly | 13.6% |
| Median drinks per binge | 5.6 |
| Top 25% drinkers median drinks | 7.9 |
| Median binge frequency | 1.5 times/month |
| Top 25% binge frequency | 3.8 times/month |
| Per capita consumption | 1.85 gallons |
| State rank for consumption | 47th |
While Oklahoma ranks relatively low in overall per capita consumption, the binge drinking patterns among regular users are concerning, particularly among the most frequent consumers.
Youth Statistics
- State ranking for youth alcohol consumption: 3rd nationally
- Percentage of alcohol consumed by underage youth: 17%
- High school students (9th-12th grade) lifetime alcohol use: 68%
- Driving statistics for 9th-12th graders: 24% drove while drinking (past 30 days); 40% rode with drinking drivers (past 30 days)
Oklahoma’s youth show particularly troubling patterns, with the state ranking third nationally for underage consumption and showing dangerous behaviors related to drinking and driving.
Youth Alcohol Use Changes (Ages 12-17)
2002-2004 to 2017-2019:
- Significant decrease to 7.4%
- Current level: 23,000 youth
- Comparable to regional (9.4%) and national (9.4%) averages
While showing improvement over time, youth alcohol use remains a significant concern, affecting thousands of young Oklahomans.
Binge Drinking Patterns
Young Adult Binge Drinking (Ages 18-25)
2017-2019 average: 36.4% (153,000 individuals)
Comparison:
- Regional average: 32.2%
- National average: 35.4%
Heavy alcohol use (21+): 159,000 reported 5+ drinks on 5+ occasions monthly
Oklahoma exceeds both regional and national averages for young adult binge drinking, indicating a particular challenge with excessive consumption in this age group.
Age-Group Specific Statistics (2018-2019)
Past Month Alcohol Use (in thousands)
| Age Group | Number | Percentage |
| 12+ | 1,438 | 44.48% |
| 12-17 | 26 | 8.23% |
| 18-25 | 216 | 51.80% |
| 26+ | 1,196 | 47.87% |
| 18+ | 1,412 | 48.43% |
Past Month Binge Alcohol Use (in thousands)
| Age Group | Number | Percentage |
| 12+ | 692 | 21.39% |
| 12-17 | 16 | 4.97% |
| 18-25 | 134 | 32.14% |
| 26+ | 542 | 21.69% |
| 18+ | 676 | 23.19% |
Young adults (18-25) show the highest rates of both general alcohol use and binge drinking, with over half engaging in alcohol use and nearly a third engaging in binge drinking.
Risk Perception and Disorder Statistics
Perception of Great Risk (5+ Drinks Weekly)
| Age Group | Number (thousands) | Percentage |
| 12+ | 1,390 | 42.98% |
| 12-17 | 129 | 40.66% |
| 18-25 | 153 | 36.61% |
| 26+ | 1,108 | 44.35% |
| 18+ | 1,261 | 43.24% |
Alcohol Use Disorder
| Age Group | Number (thousands) | Percentage |
| 12+ | 177 | 5.47% |
| 12-17 | 5 | 1.64% |
| 18-25 | 42 | 10.03% |
| 26+ | 130 | 5.19% |
| 18+ | 172 | 5.88% |
Despite high usage rates, less than half of Oklahomans perceive regular heavy drinking as high risk, with young adults showing the lowest risk perception despite having the highest disorder rates.
Regional Trends (Tulsa County Focus)
Treatment admissions:
- Primary alcohol choice: 27%
- Alcohol as a factor: 45%
Binge drinking rates:
- Overall: 14.3%
- Ages 18-34: 21%
DUI rate: 20% above state average
Tulsa County’s statistics mirror state trends but show even higher DUI rates, suggesting particular challenges with drunk driving in urban areas. The high percentage of young adult binge drinking indicates a need for targeted intervention in metropolitan areas.
Healthcare and Treatment
Treatment Statistics
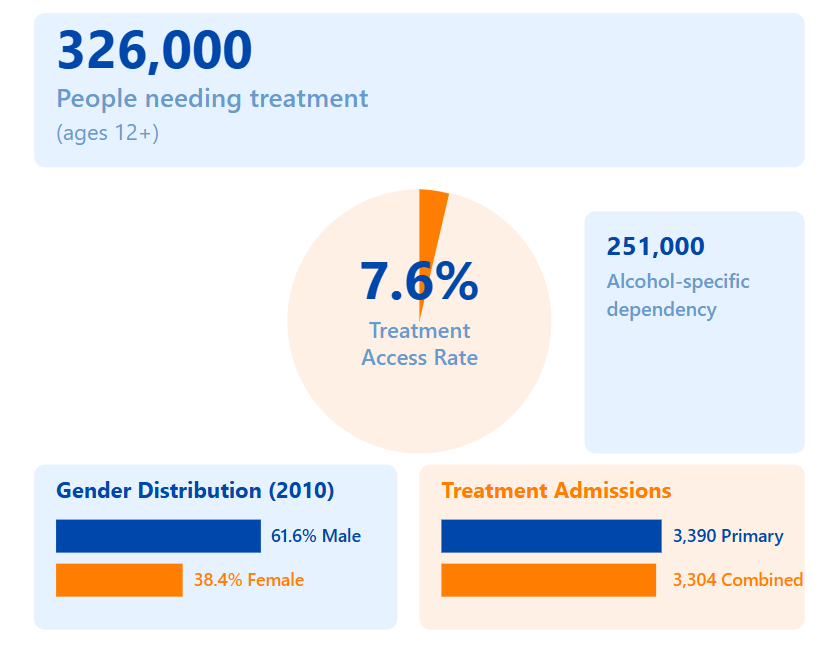
- Total needing treatment (ages 12+): 326,000
- Alcohol-specific dependency: 251,000
- Treatment access rate: 7.6%
- Treatment demographics (2010): male: 61.6%; female: 38.4%
- Primary alcohol treatment admissions: 3,390
- Combined alcohol and secondary drug treatment: 3,304
Emergency Room Impact
- 40% of youth drug-related visits involve alcohol
- 24-31% of ER patients test positive
- 50% of severe trauma cases are alcohol-related
The low treatment access rate (7.6%) compared to the high need indicates a significant treatment gap. The high ER statistics suggest alcohol’s major impact on emergency medical services.
Treatment Need vs. Access
People Needing But Not Receiving Treatment
| Age Group | Number | Percentage |
| 12+ | 167 | 5.18% |
| 12-17 | 5 | 1.66% |
| 18-25 | 40 | 9.48% |
| 26+ | 123 | 4.91% |
| 18+ | 162 | 5.56% |
The treatment gap is particularly pronounced among young adults, with nearly 10% needing but not receiving treatment, highlighting significant barriers to access.
Criminal Justice Impact
Alcohol-Related Crime Statistics
Total alcohol-related arrests (2014): 30,796
Percentage of offenders under influence during crimes:
- Homicide offenders: 86%
- Sexual offenders: 60%
- Assault offenders: 37%
- Marital violence: 57% men, 27% women
- Child abusers: 13%
The data demonstrates alcohol’s significant role in various types of criminal behavior, particularly violent crimes, with a notably high correlation to homicide and sexual offenses.
Economic Impact
Cost Breakdown (2022 adjusted figures)
- Total cost to taxpayers: $4.16 billion
- Cost per drink: $3.36
- Annual underage drinking cost: $1 billion
- Industry impact from underage drinking: sales: $258.6 million; profits: $126.6 million
The economic burden is substantial, affecting both public resources and private sector productivity, with significant costs associated with underage drinking alone.
Oklahoma faces a severe alcohol crisis, ranking 6th nationally for alcohol-related mortality with 2,104 annual deaths and a $4.16 billion economic burden. Despite ranking 47th in per capita consumption, the state shows alarming patterns, particularly among youth (ranking 3rd for underage consumption), while only 7.6% of those needing treatment receive it. The stark contrast between low consumption rankings and severe outcomes, including high crime rates and traffic fatalities, highlights an urgent need for enhanced prevention and treatment strategies.
In general, Oklahoma faces a dual crisis of drug and alcohol abuse, with particularly alarming trends in both sectors. The state reports over 1,200 drug overdose deaths (2023), with dramatic increases in methamphetamine (732 deaths) and fentanyl (730 deaths), while simultaneously recording 2,104 alcohol-related deaths annually. The combined economic burden is staggering, with substance abuse treatment gaps remaining critical – only 7.6% of those needing alcohol treatment receive it, while 229,000 people need but don’t receive drug treatment. Young adults (18-25) emerge as the highest-risk demographic across both substances, highlighting an urgent need for targeted intervention strategies and expanded treatment accessibility.
Sources:
- Drug Abuse Statistics
- Oklahoma State Department of Health
- Mental Health and Substance Use State Fact Sheets: Oklahoma | KFF
- OKLAHOMA – National Survey on Drug Use and Health
- National Center for Drug Abuse Statistics For Oklahoma — Key Choices
- Data snapshot: Methamphetamine in Oklahoma
- OKLAHOMA DRUG CONTROL UPDATE Drug Use Trends in Oklahoma Substance Abuse Treatment Admissions Data
- Analyzing the impact of SB 511, Oklahoma’s harm reduction law
- Oklahoma Drug Statistics, Oklahoma Prescription Drug Abuse Statistics
- National Institute on Drug Abuse (NIDA) – Oklahoma Opioid Summary
- Methamphetamine is killing more Oklahomans than any other drug | KOSU
- Behavioral Health Barometer: Oklahoma, Volume 6
- Alcohol Abuse | Cheyenne Public Schools
- Alcohol: Its Impact on Oklahoma
- Oklahoma in top 10 states for alcohol-related deaths