Statistical Data on Drugs in New Hampshire
New Hampshire faces one of the most severe drug crises in the United States, ranking among the top states for overdose death rates. The state has experienced a dramatic surge in drug-related fatalities, with deaths increasing by 953% between 2000 and 2018. Based on different survey methods, including hair drug test results, the crisis is primarily driven by opioids, particularly synthetic substances like fentanyl, which have become increasingly prevalent. This comprehensive analysis presents the current state of drug and substance abuse in New Hampshire based on official data from various state and federal agencies.
Overall Drug Overdose Statistics
Current Death Rates
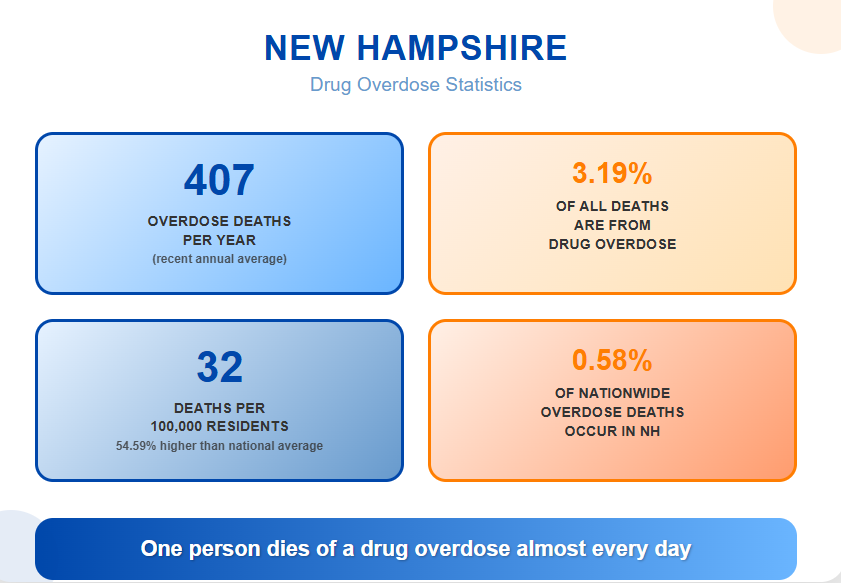
- 407 overdose deaths per year (recent annual average)
- 3.19% of all deaths are from drug overdose
- 32 deaths per 100,000 residents (54.59% higher than national average)
- 0.58% of nationwide overdose deaths occur in New Hampshire
- One person dies of a drug overdose almost every day in New Hampshire
New Hampshire’s overdose death rate significantly exceeds the national average, indicating a severe public health crisis that requires immediate attention and comprehensive intervention strategies.
Recent Trends
- 12% decrease in drug overdose deaths from 2022 to 2023 (first decrease in four years)
- 430 drug overdose deaths in 2023 (down from previous years)
- 6.31% annual decrease in overdose deaths over the last 3 years
- 10% increase in deaths from suicide, alcohol, or drugs from 2021 to 2022 (greatest increase of any state)
While the recent decrease in overdose deaths is encouraging, New Hampshire still leads the nation in the rate of increase for deaths from substances and suicide, suggesting the crisis remains severe.
County-Level Data (2019-2022)
| County | 4-Year Total Deaths | Age-Adjusted Rate (per 100,000) |
| Coos | 58 | 53.81 |
| Strafford | 220 | 43.01 |
| Belknap | 78 | 36.49 |
| Sullivan | 57 | 35.37 |
| Hillsborough | 582 | 34.60 |
| Carroll | 56 | 33.64 |
| Merrimack | 170 | 28.57 |
| Cheshire | 76 | 27.60 |
| Grafton | 73 | 23.31 |
| Rockingham | 271 | 21.53 |
Coos County shows the highest per-capita death rate despite having fewer total deaths, while Hillsborough County has the highest absolute numbers, reflecting both population density and severity of the crisis.
Opioid Crisis Statistics
Current State
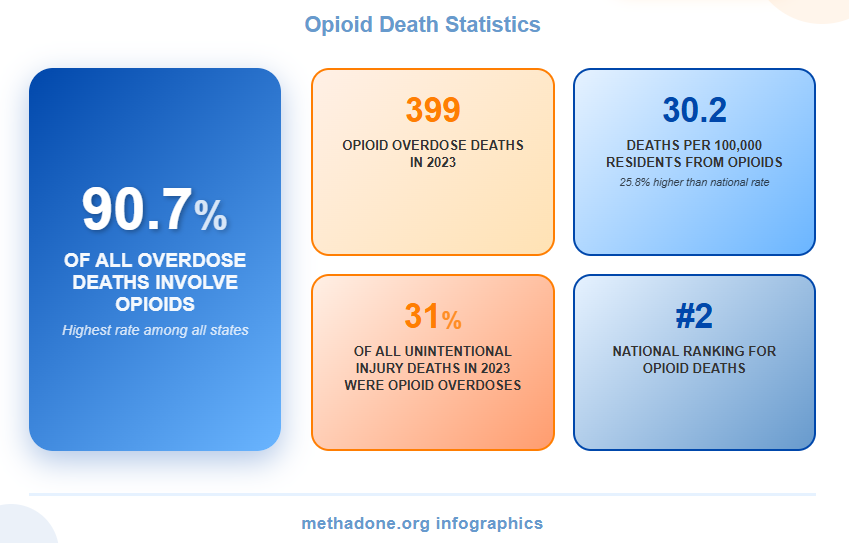
- New Hampshire ranks 2nd nationally for opioid deaths
- 90.7% of all overdose deaths involve opioids (highest rate among all states)
- 399 opioid overdose deaths in 2023
- 30.2 deaths per 100,000 residents from opioids (25.8% higher than national rate)
- 31% of all unintentional injury deaths in 2023 were opioid overdoses
New Hampshire’s opioid crisis is disproportionately severe compared to other states, with opioids involved in nearly all overdose deaths, indicating the need for targeted opioid-specific interventions.
Opioid Types and Trends
- 95.2% of opioid overdose deaths involve synthetic opioids (primarily fentanyl)
- 6.3% involve prescription opioids
- 1,590% increase in fentanyl-related deaths between 2017-2020
- Fentanyl involved in 80% of drug overdose deaths in 2017
- 69% of drug overdose fatalities in 2022 were attributed to fentanyl
The dramatic shift toward synthetic opioids, particularly fentanyl, represents a fundamental change in the nature of the overdose crisis, requiring updated prevention and treatment approaches.
Demographics of Overdose Deaths (2019-2022)
| Characteristic | Percentage | Count |
| Male | 70.3% | 1,105 |
| Female | 29.7% | 467 |
| White | 95.3% | 1,498 |
| Non-Hispanic | 96.6% | 1,518 |
| Never Married | 55.7% | 875 |
| High School/GED | 59.7% | 939 |
| Age 30-39 | 32.1% | 505 |
Overdose deaths disproportionately affect middle-aged white males who are unmarried and have high school education, suggesting targeted prevention programs should focus on this demographic.
Youth Substance Use
Current Rates (Ages 12-17)
- 7.67% used illicit drugs in the last month (5.65% higher than national average)
- 8.75% used alcohol in the last month (27.15% higher than national average)
- 11.09% used marijuana in the last year
- 85.71% of teen drug users reported marijuana use
- 6.32% met criteria for Drug Use Disorder
- 2.76% met criteria for Alcohol Use Disorder
New Hampshire teens show significantly higher rates of substance use compared to national averages, particularly for alcohol, indicating early intervention programs are crucial.
Youth Drug Use by Type
- Marijuana: 9.1% past-month use (higher than national 6.8%)
- Pain relievers: 2.09% past-year misuse
- Cocaine: 0.25% past-year use
- Methamphetamine: 0.13% past-year use
Marijuana dominates youth drug use patterns, but the presence of harder drugs among adolescents is concerning and requires comprehensive prevention strategies.
Young Adult Substance Use (Ages 18-25)
Current Statistics
- 44,000 adults used drugs in the last month
- 22.76% more likely to use drugs than national average
- 49.7% engaged in binge alcohol use (vs. 35.4% nationally)
- 45.7% used marijuana in the past year (vs. 35.0% nationally)
- 22.0% had substance use disorder (vs. 14.7% nationally)
Young adults in New Hampshire show dramatically higher rates of substance use across all categories, suggesting this age group requires intensive intervention and support services. Additionally, many individuals who conume marijuana try to cheat hair drug tests, which is also a serious problem.
Treatment and Recovery Indicators
- 5.5% had marijuana use disorder
- 8.0% had illicit drug use disorder
- 0.5% had opioid use disorder
- 18.2% had alcohol use disorder (nearly double national average)
The high rates of substance use disorders among young adults indicate that early adult years are a critical intervention period for preventing long-term addiction.
Treatment and Healthcare System Response
Treatment Capacity and Utilization
- 88 active substance abuse clinics statewide
- 6,473 patients treated annually for drug rehabilitation
- 4,982 patients in outpatient services annually
- 883 patients in residential services annually
- Only 1 facility offers free drug rehabilitation treatment
The treatment infrastructure appears insufficient given the scale of the crisis, with very limited free treatment options creating potential barriers to care. That’s why many individuals try to detox from weed at home.
Treatment Costs
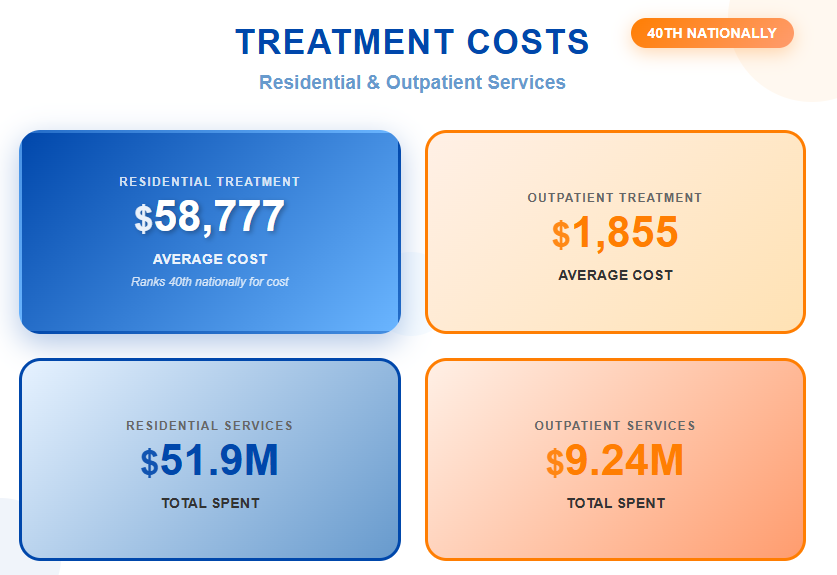
- $58,777 average cost for residential treatment (ranks 40th nationally for cost)
- $1,855 average cost for outpatient treatment
- $51.9 million total spent on residential treatment
- $9.24 million spent on outpatient services
High treatment costs, particularly for residential care, may create significant barriers to accessing needed services for many individuals struggling with addiction.
Treatment Patterns (2019 Single-Day Count)
- 69.6% received treatment for drug problems only
- 10.4% received treatment for alcohol problems only
- 20.0% received treatment for both drug and alcohol problems
- 2,959 people receiving methadone treatment
- 918 people receiving buprenorphine treatment
The majority of treatment admissions are for drug-related issues, reflecting the severity of the illicit drug crisis, while medication-assisted treatment utilization shows room for expansion.
Emergency Response and Healthcare Impact
Emergency Medical Services
- 4,308 fatal and non-fatal overdose incidents reported to EMS in 2023
- 5,045 EMS drug abuse incidents in 2022 (up from 2,545 in 2016)
- 70.9% of overdose deaths had EMS presence
- 22.4% of overdose deaths received naloxone administration
- 66.8% of overdose deaths had at least one bystander present
The increasing EMS response to drug incidents indicates growing community impact, while the relatively low naloxone administration rate suggests opportunities for improvement in emergency response protocols.
Healthcare Consequences
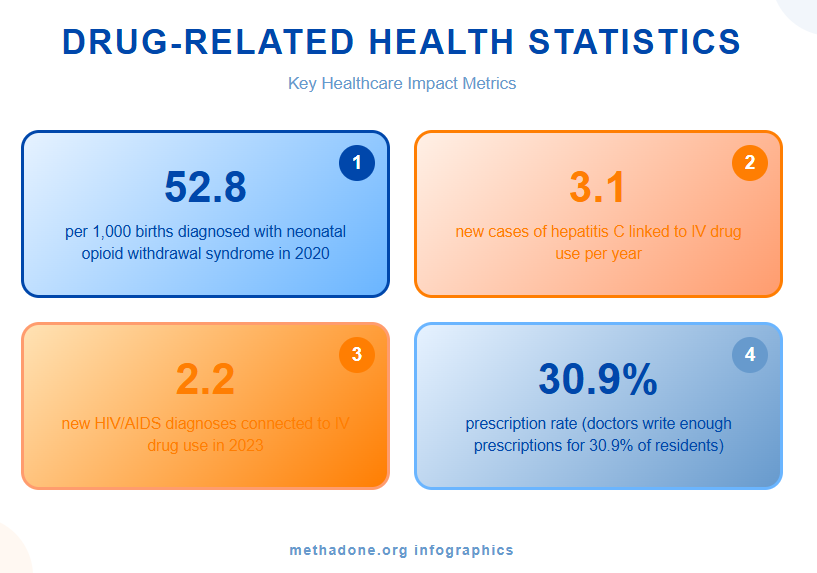
- 52.8 per 1,000 births diagnosed with neonatal Opioid Withdrawal syndrome in 2020
- 3.1 new cases of hepatitis C linked to IV drug use per year
- 2.2 new HIV/AIDS diagnoses connected to IV drug use in 2023
- 30.9% prescription rate (doctors write enough prescriptions for 30.9% of residents)
The health system faces significant secondary impacts from drug use, including neonatal complications and infectious diseases, requiring comprehensive medical responses beyond overdose treatment.
Population-Level Impact
Overall Substance Use Disorders (Ages 12+)
- 107,000 individuals (9.1% of population) had substance use disorder in past year
- 2.9% had illicit drug use disorder
- 0.8% had opioid use disorder
- 1.5% had marijuana use disorder
- 20.9% used marijuana in past year
Nearly 1 in 10 New Hampshire residents struggles with substance use disorder, indicating this is a widespread public health challenge affecting families and communities across the state.
Intervention Opportunities
- 77.2% of overdose victims had no history of substance use treatment
- 86.2% had no history of reported drug overdose
- 16% were recently released from supervised facilities
- 87% of deaths in 2021 had at least one potential intervention opportunity
The high percentage of overdose victims without treatment history suggests significant gaps in connecting at-risk individuals to services, while the prevalence of intervention opportunities indicates potential for prevention.
Economic Impact
Financial Costs
- $959.9 million cost of excessive alcohol use in 2010 ($1.296 billion adjusted for inflation)
- $1.24 per drink in societal costs
- $5,953 per capita expenditure on opioid overdoses in 2017 (89.9% higher than national average)
The economic burden of substance abuse is substantial, affecting not only healthcare costs but broader societal expenses, justifying significant investment in prevention and treatment programs.
Key Risk Factors and Patterns
Historical Context
- New Hampshire was in top 10 states for drug use rates in multiple categories (2009-2010)
- 12.15% of residents reported past-month illicit drug use (vs. 8.82% nationally)
- Drug use rates have historically been significantly higher than national averages across all age groups
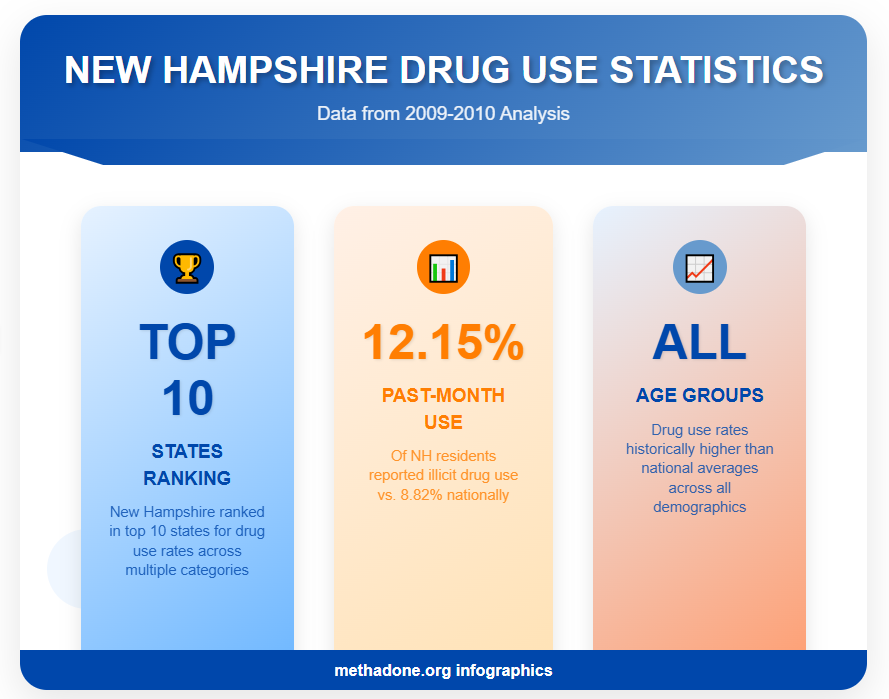
New Hampshire’s substance abuse crisis has deep historical roots, with consistently higher usage rates suggesting systemic factors that require long-term, comprehensive approaches to address effectively.
Current Challenges
- Rapid overdose evidence present in 22.7% of deaths
- Injectable drug use accounts for 29.9% of overdose deaths
- Multiple drug involvement common in overdose cases
- Geographic disparities with rural counties often having highest per-capita rates
The complexity of the current drug crisis, involving multiple substances and rapid onset overdoses, requires sophisticated medical and social responses tailored to different geographic and demographic contexts.
New Hampshire faces one of the nation’s most severe substance abuse crises, ranking second nationally for opioid deaths with 90.7% of overdoses involving opioids. Despite a recent 12% decrease in deaths, critical gaps remain in treatment access, with 77% of overdose victims having no treatment history. The crisis requires comprehensive intervention across prevention, treatment expansion, and emergency response to address the devastating impact on communities statewide.
Statistical Data on Alcohol in New Hampshire
New Hampshire presents a complex picture regarding alcohol consumption and abuse, characterized by the nation’s highest per-capita alcohol consumption rates alongside relatively responsible drinking behaviors in certain areas. While the state has achieved the lowest rate of under-21 alcohol-related deaths nationally, it faces significant challenges with adult binge drinking and alcohol use disorders, particularly among young adults. The economic impact is substantial, with nearly $1 billion in costs attributed to excessive alcohol use, yet alcohol sales generate significant revenue for the state.
Alcohol Death Statistics
Overall Death and Impact Data
- 661 total annual deaths attributable to excessive alcohol use
- 1.7% of alcohol deaths involve people under 21 (lowest rate nationally)
- 55.5% increase in excessive alcohol death rate from 2015-2019
- 5.91 deaths per 10,000 adults from excessive alcohol use
- 1 death for every 2,084 people aged 18 and older
While New Hampshire has successfully reduced underage drinking fatalities, the dramatic increase in adult alcohol deaths over recent years indicates a growing public health crisis among the adult population.
Demographic Breakdown of Alcohol Deaths
- 69.7% of deaths are male
- 85.2% of deaths are adults aged 35 and older
- 59.9% of deaths are from chronic causes (such as Alcohol Use Disorder)
- 1.66% of deaths involve people under age 21
Alcohol-related deaths predominantly affect middle-aged and older males, with the majority resulting from chronic conditions rather than acute incidents, suggesting long-term patterns of excessive use.
Current Alcohol Consumption Patterns
Adult Consumption Rates
- 4.76 gallons per capita annually (highest in the nation)
- 18.3% of adults binge drink at least once per month
- 18.0% of adults engage in excessive drinking (binge or heavy drinking)
- Median 5.5 drinks per binge episode
- 7.6 drinks per binge among the 25% most active drinkers
New Hampshire’s status as having the highest per-capita alcohol consumption nationally, combined with significant binge drinking rates, indicates widespread problematic drinking patterns across the adult population.
Binge Drinking Frequency
- Median 1.5 times monthly for binge drinking adults
- 4.0 times per month among the 25% most active drinkers
- Target consumption goal: 2.1 gallons or less per capita (set by public officials in 2020)
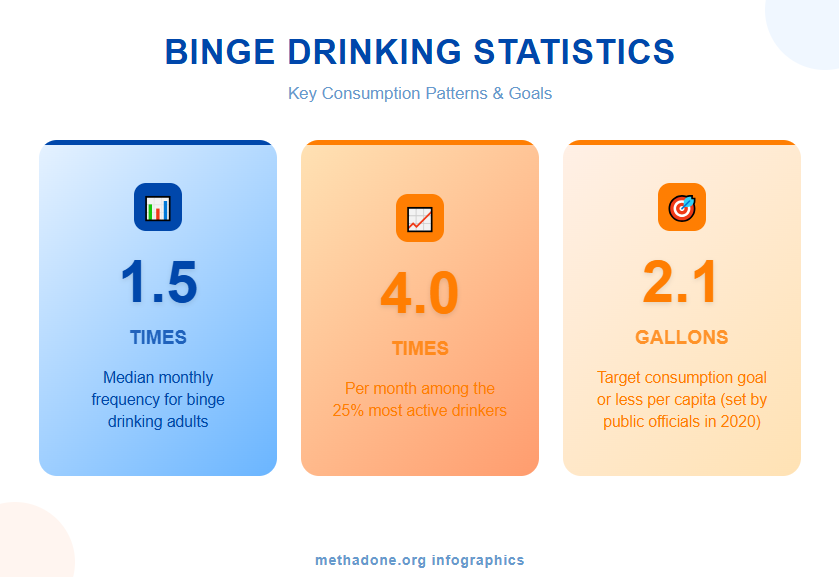
The frequency of binge drinking, particularly among heavy users who binge 4 times monthly, suggests a pattern of regular excessive consumption that poses serious health risks.
Age-Specific Alcohol Use Patterns
Youth Alcohol Use (Ages 12-17)
- 9.9% used alcohol in the past month (2017-2019)
- Decreased from previous years (2002-2004 to 2017-2019)
- Similar to regional (12.6%) and national (9.4%) averages
- 21% of teens engage in binge drinking (significantly higher than 15% in New York)
While monthly alcohol use among teens has decreased and remains near national averages, the high binge drinking rate among New Hampshire teens is concerning and suggests when teens do drink, they do so excessively.
Young Adult Alcohol Use (Ages 18-25)
- 49.7% engaged in binge drinking in the past month (vs. 35.4% nationally)
- 18.2% had alcohol use disorder (vs. 9.8% nationally)
- 26,000 young adults with alcohol use disorder
- 70,000 young adults engaged in binge drinking
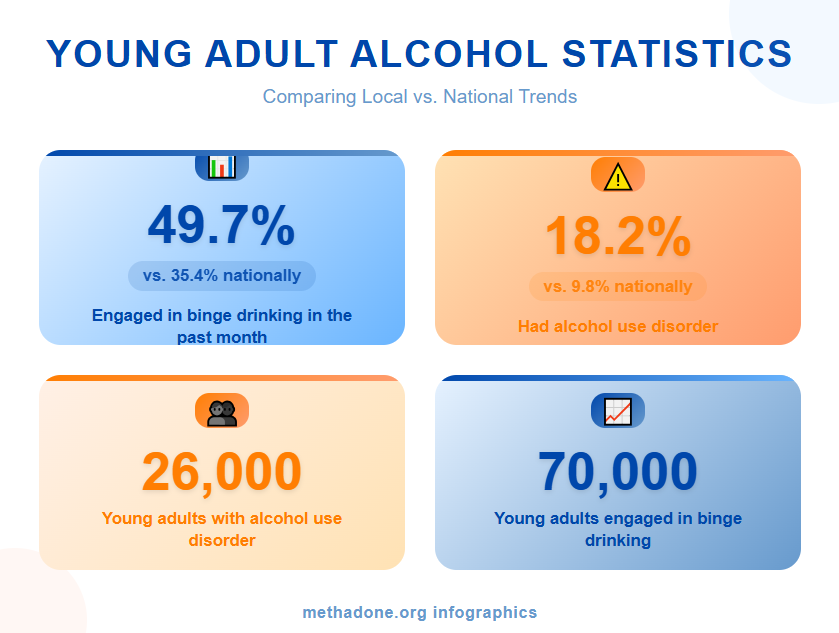
Young adults in New Hampshire show dramatically higher rates of both binge drinking and alcohol use disorder compared to national averages, indicating this age group faces particularly severe alcohol-related challenges.
Alcohol Use Disorders Across All Ages
General Population (Ages 12+):
- 7.0% had alcohol use disorder in the past year (vs. 5.3% nationally)
- 82,000 individuals with alcohol use disorder
- Similar to regional average (6.4%) but higher than national average
Alcohol use disorders affect a significant portion of New Hampshire’s population at rates exceeding national averages, indicating the need for expanded treatment and prevention services.
Treatment and Healthcare System Response
Treatment Admissions:
- 1,638 people admitted for alcohol treatment
- 1,166 people admitted for combined alcohol and secondary substance treatment
- Total of 2,804 alcohol-related admissions
- 6,234 increase in total drug and alcohol admissions in 2010
The substantial number of treatment admissions, particularly for combined alcohol and drug abuse, reflects the complexity of substance abuse issues and the significant burden on the treatment system.
Economic Impact and Industry
- $959.9 million cost of excessive alcohol use in 2010
- $1.296 billion adjusted for inflation (2022 dollars)
- $1.24 cost per drink to society
- 16,902 years of potential life lost annually to excessive alcohol use
- Nearly $800 million in annual alcohol sales revenue
While alcohol generates substantial revenue for the state, the social costs significantly exceed these benefits, with over $1 billion in annual costs and substantial loss of life years.
Traffic Safety and Responsible Drinking Indicators
Drunk Driving Statistics:
- 35 traffic fatalities per million licensed drivers (despite highest consumption)
- 27 alcohol-related traffic deaths in 2011 (49.6% decrease from 2001)
- 86% of fatal accidents caused by drivers with BAC of 0.15 or higher
- 100% of drivers with BAC 0.15+ were repeat offenders
- 3,616 DUI arrests in 2011
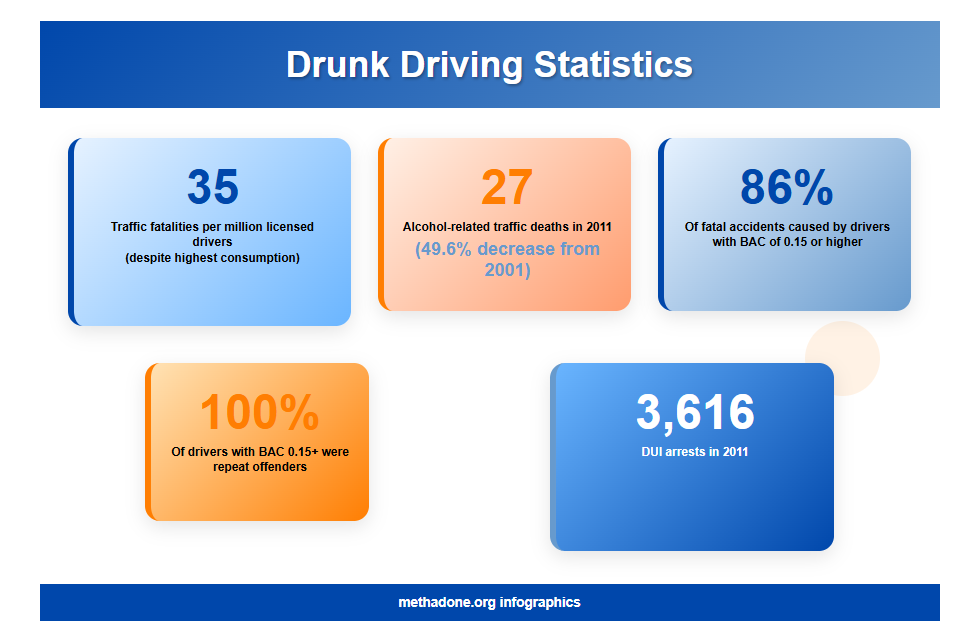
Despite having the highest alcohol consumption, New Hampshire shows relatively responsible drinking behaviors regarding driving, with low traffic fatality rates and decreasing drunk driving deaths, though repeat offenders remain a significant concern.
Public Health Rankings and Comparisons
National Rankings
- Rank 34 nationally for excessive drinking (18.0% of adults)
- Lowest rate nationally for under-21 alcohol deaths
- Highest per-capita consumption nationally (4.76 gallons)
New Hampshire presents a paradox of having the highest consumption but relatively moderate excessive drinking rankings, suggesting patterns of regular consumption that may not always reach the threshold of clinical “excessive” drinking despite high overall volume.
In general, New Hampshire confronts an unprecedented dual crisis of drug and alcohol abuse that significantly exceeds national averages across virtually all metrics. The state leads the nation in per-capita alcohol consumption (4.76 gallons annually) while ranking second nationally for opioid deaths, with 90.7% of overdoses involving opioids and fentanyl deaths increasing by 1,590% between 2017-2020. Despite some progress in reducing underage drinking fatalities and recent decreases in drug overdose deaths, the combined economic burden exceeds $2 billion annually, with young adults showing particularly alarming rates of substance use disorders that are nearly double national averages. The crisis demands immediate, comprehensive intervention strategies addressing prevention, treatment accessibility, and emergency response systems to prevent further deterioration of public health outcomes statewide.
Sources:
- Drug Abuse Statistics
- NEW HAMPSHIRE DRUG CONTROL UPDATE Drug Use Trends in New Hampshire Substance Abuse Treatment Admission Data
- Behavioral Health Barometer: New Hampshire, Volume 6
- New Hampshire Drug Overdose Fatality Review Commission – Annual Statistical Report, 2019-2022
- New Hampshire Addiction Statistics
- Drug Overdose Statistics New Hampshire
- What Factors Lead to Excessive Alcohol Consumption in New Hampshire?
- Explore Excessive Drinking in New Hampshire | AHR
- Alcohol Facts – The Partnership
- Alcohol Abuse is Rampant In New Hampshire
- New Hampshire Has the Most Responsible Drinkers | Russman Law