Statistical Data on Drugs in Nevada
The data reveals significant public health challenges, with Nevada consistently ranking above national averages in multiple substance use categories. The statistics highlight concerning trends in youth drug use, rising overdose deaths, and the evolving nature of the drug crisis from prescription opioids to synthetic substances like fentanyl and methamphetamine.
Overdose Death Statistics
Current Mortality Rates
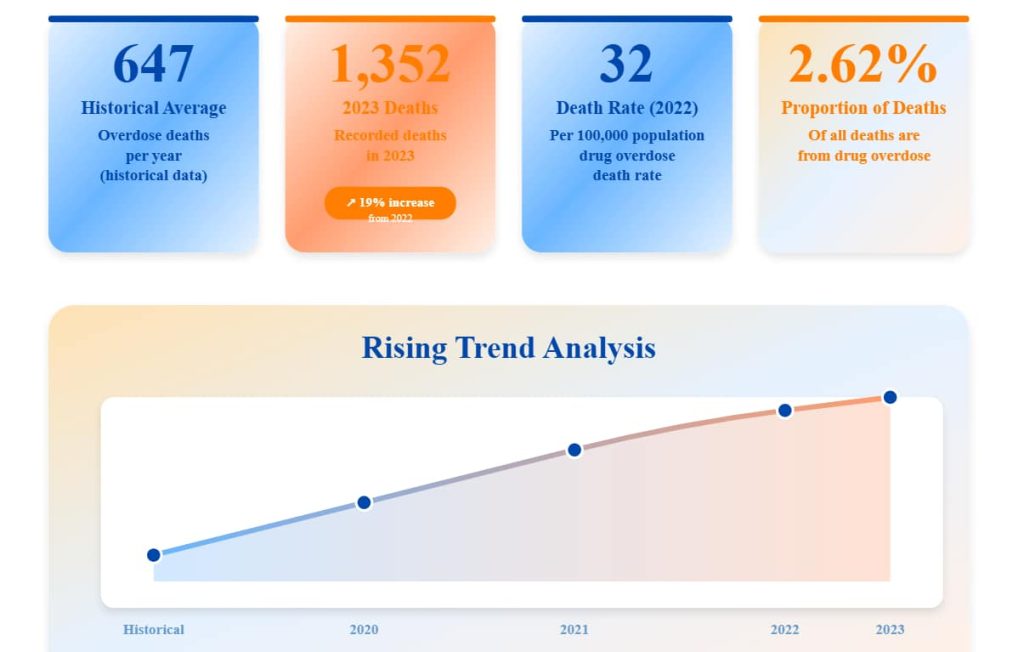
- 647 overdose deaths per year (historical data)
- 1,352 deaths recorded in 2023 (19% increase from 2022)
- 32 per 100,000 drug overdose death rate in 2022
- 2.62% of all deaths are from drug overdose
Opioid-Related Deaths
- 904 opioid-related overdoses in 2023 (28% increase from 2022)
- 372 opioid overdose deaths (11.5 per 100,000 residents)
- 123% increase in opioid overdoses from 2020-2023
Drug-Specific Mortality (2023)
- 773 psychostimulant deaths (74% increase from 2020)
- 65 heroin overdose deaths (55% decrease from 2020)
- 158 cocaine overdose deaths
Nevada’s overdose crisis is intensifying, with a notable shift from heroin to synthetic opioids and psychostimulants. The 19% increase in total overdose deaths from 2022 to 2023 indicates an accelerating crisis, with rural counties disproportionately affected.
Regional and Demographic Disparities
County-Level Overdose Rates (2022)
| County | Deaths per 100,000 |
| Nye County | 62.1 |
| Elko County | 46.3 |
| Washoe County | 42.3 |
| Lyon County | 32.5 |
| Clark County | 28.8 |
Age and Gender Disparities
- Males: 38.3 per 100,000 overdose death rate
- Females: 20.3 per 100,000 overdose death rate
- Ages 55-64: 145.6 deaths per 100,000 (highest rate)
- Ages 65-74: 134.0 deaths per 100,000
Rural counties show significantly higher overdose rates than urban areas, suggesting challenges in accessing treatment and harm reduction services. The higher mortality rates among older adults indicates that substance use disorders affect all age groups, not just youth.
Youth Drug Use Statistics (Ages 12-17)
Current Usage Rates
- 24,000 (10.24%) of Nevada teens report using drugs in the last month
- Nevada teens are 22.98% more likely to have used drugs than the average American teen
- 91.67% of teen drug users report using marijuana in the last month
- 16.65% of all teens report using marijuana in the last year
Specific Drug Usage Among Teens
- 0.43% reported using cocaine in the last year
- 0.21% report using methamphetamines
- 0.21% used heroin
- 2.99% report misusing pain relievers
Teen Substance Use Disorders
- 4.70% of teens met criteria for Illicit Drug Use Disorder (IDUD)
- 1.71% met criteria for Alcohol Use Disorder (AUD)
- Youth in Nevada are 175% more likely to meet IDUD criteria than AUD criteria
Nevada’s youth substance use rates are significantly elevated compared to national averages, with marijuana being the predominant drug of choice. The higher likelihood of developing drug use disorders compared to alcohol use disorders among teens is particularly concerning and suggests early intervention programs should focus heavily on illicit drug prevention.
Adult Substance Use Statistics
Current Usage Patterns (2022)
- 23.6% of adults aged 18+ used illicit drugs in the past month (vs. 16.3% national average)
- 28.3% used marijuana (higher than national average)
Specific Drug Usage Rates (2022)
- 4.4% used hallucinogens
- 2.2% used methamphetamine
- 1.8% used cocaine
- 4.2% engaged in opioid misuse (vs. 3.4% national average)
Substance Use Disorders (2022)
- 20.9% prevalence of substance use disorder among individuals aged 12+
- 12.7% had drug use disorder
- 2.0% had opioid use disorder (similar to national average)
Nevada’s adult population shows consistently higher rates of substance use across most categories compared to national averages. The state’s legalized marijuana environment correlates with significantly higher usage rates, while opioid misuse remains a critical concern.
Age-Specific Substance Use Patterns (2022-2023)
By Age Group Usage Rates
| Substance | Ages 12+ | Ages 12-17 | Ages 18-25 | Ages 26+ |
| Illicit Drug Use (Past Month) | 22.03% | 8.54% | 31.91% | 22.22% |
| Marijuana Use (Past Year) | 29.76% | 13.33% | 45.61% | 29.47% |
| Cocaine Use (Past Year) | 1.76% | 0.23% | 3.23% | 1.73% |
| Hallucinogen Use (Past Year) | 3.67% | 1.95% | 9.85% | 3.03% |
| Methamphetamine Use (Past Year) | 1.63% | 0.10% | 0.26% | 1.98% |
Substance Use Disorders by Age
| Disorder Type | Ages 12+ | Ages 12-17 | Ages 18-25 | Ages 26+ |
| Substance Use Disorder | 21.32% | 10.05% | 31.07% | 21.28% |
| Drug Use Disorder | 12.17% | 8.26% | 23.06% | 11.14% |
| Opioid Use Disorder | 2.52% | 1.23% | 1.36% | 2.82% |
Young adults (18-25) show the highest rates of substance use and disorders across most categories, indicating this age group requires targeted intervention strategies. The relatively high rates among older adults (26+) suggest substance use issues persist throughout adulthood.
Specific Drug Trends
Methamphetamine
- 57% of overdose deaths involved methamphetamine (2022)
- 330% increase in seizures in Northern Nevada (2008-2015)
Fentanyl and Synthetic Opioids
- 43% of overdose deaths involved synthetic opioids (2022)
- 97% increase in combined fentanyl-methamphetamine deaths (2020-2023)
- 13.1 times increase in fentanyl deaths (1999-2022)
Marijuana
- 28.3% adult past-year use (2022)
- 130% increase from 2013-2021
- Youth use declined from 29% (2017) to 15.9% (2022)
Methamphetamine remains the primary driver of overdose deaths, while synthetic opioids represent a rapidly growing threat. The contrasting trends in marijuana use between adults and youth suggest that legalization has had different impacts across age groups.
Co-Occurring Mental Health and Substance Use
Mental Health and Substance Use Statistics
- 33% of overdose deaths in 2021 involved individuals with documented mental health issues
- 34% of overdose deaths involved individuals with current mental health problems
- 28% had received mental health treatment
- 27% of those with opiate history have serious mental illness
- 64% have any mental illness
The high prevalence of co-occurring mental health and substance use disorders highlights the need for integrated treatment approaches. The fact that only 28% of overdose victims had received mental health treatment suggests significant gaps in mental health service delivery.
Drug Treatment and Rehabilitation Statistics
Treatment Facility Information
- 116 active substance abuse clinics statewide
- 7,249 patients treated annually for drug rehabilitation
- 4,260 patients enrolled in outpatient services annually
- 249 patients enrolled in residential (non-hospital) services
- 5 facilities offer free drug rehabilitation treatment
Treatment Costs
- $62,530 average cost for residential treatment (tied for 44th most expensive state)
- $1,626 average cost for outpatient treatment
- $6.93 million spent on outpatient services (0.3% of U.S. total)
- $15.57 million spent on residential treatment (0.3% of U.S. total)
Treatment Enrollment by Problem Type (2019)
- 47.6% received treatment for drug problems only
- 34.4% received treatment for both drug and alcohol problems
Treatment Gaps
- Only 5.22% received substance use treatment
- 23.43% classified as needing treatment
- 77.37% of those needing treatment did not receive it
Despite having adequate treatment infrastructure, Nevada shows a significant treatment gap with over three-quarters of individuals needing treatment not receiving it. The high cost of residential treatment may be a barrier to access.
Criminal Justice and Drug-Related Arrests
Arrest and Conviction Trends (2016-2023)
| Year | Total Arrests | Drug-Related Arrests | % Drug-Related | Drug Convictions | % Drug-Related Convictions |
| 2016 | 46,276 | 6,964 | 15.0% | 7,225 | 15.6% |
| 2017 | 45,247 | 5,403 | 11.9% | 6,495 | 14.4% |
| 2018 | 48,570 | 6,516 | 13.4% | 7,401 | 15.2% |
| 2019 | 51,750 | 6,878 | 13.3% | 5,839 | 11.3% |
| 2020 | 37,107 | 6,117 | 16.5% | 3,775 | 10.2% |
| 2021 | 34,502 | 6,758 | 19.6% | 4,609 | 13.4% |
| 2022 | 28,758 | 5,608 | 19.5% | 4,252 | 14.8% |
| 2023 | 16,049 | 3,129 | 19.5% | 2,115 | 13.2% |
Felony Drug Convictions
- 41% of felony convictions were drug-related in 2023 (up from 17% in 2016)
- Over 41% of new prison inmates in Nevada are incarcerated due to drug-related offenses
The proportion of drug-related arrests has increased significantly from 2017 to 2023, indicating either increased enforcement or rising drug-related criminal activity. The dramatic increase in drug-related felony convictions suggests more serious drug offenses are being prosecuted.
Prescription Drug Monitoring
PDMP Statistics (2021-2023)
49.9% of Nevada’s forensic population have prescriptions reported in PDMP
| Fiscal Year | Clients in PDMP | Total Clients | % in PDMP |
| 2021 | 275 | 565 | 48.7% |
| 2022 | 315 | 609 | 51.7% |
| 2023 | 308 | 624 | 49.4% |
Self-Disclosed Drug Use Among Forensic Clients
| Fiscal Year | Drug Users | Total Clients | Rate |
| 2021 | 242 | 565 | 42.8% |
| 2022 | 266 | 609 | 43.7% |
| 2023 | 308 | 624 | 49.4% |
The high proportion of forensic clients with PDMP records and self-disclosed drug use demonstrates the strong connection between substance use and criminal justice involvement in Nevada.
Historical Trends and Projections
Marijuana Use Trends
- 303% increase in past-month marijuana use from 2013 to 2020
- 130% increase since recreational legalization in 2017
- High school cannabis use declined from 29% in 2017 to 15.9% in 2022
Treatment Enrollment Changes
- 2,079 people receiving methadone in 2019 (increase from 1,555 in 2015)
- 333 people receiving buprenorphine in 2019 (increase from 261 in 2015)
Marijuana legalization has led to dramatic increases in adult use while youth use has actually declined, suggesting successful age-restriction enforcement. The increase in medication-assisted treatment enrollment indicates growing recognition of evidence-based treatment approaches.
Emergency Department and Hospital Statistics
Healthcare Utilization (2021)
- 69,452 emergency department visits related to alcohol and drugs
- 10,704 encounters primarily drug-related
- 54,385 hospital admissions related to alcohol and drugs
- 33,301 admissions for drugs
The healthcare system bears a significant burden from substance use, with drug-related visits and admissions outnumbering alcohol-related ones, reflecting the severity of Nevada’s illicit drug problem.
Public Health Interventions and Outcomes
Prevention and Treatment Access
- Less than 12% of individuals with substance use disorders access medication-assisted treatment
- 18% national benchmark for treatment access
- Rural counties average 1 provider per 10,000 residents
- Urban areas have 4.2 providers per 10,000 residents
Harm Reduction Efforts
- Naloxone distribution increased 400% since 2018
- Reportedly prevented 1,200 overdose deaths
- Opioid prescribing rates dropped 30% from 2017-2022
While harm reduction efforts like naloxone distribution show positive results, significant treatment gaps remain, particularly in rural areas. The low medication-assisted treatment access rate indicates substantial room for improvement in evidence-based treatment delivery.
This data reveals Nevada faces substantial challenges with substance abuse across all demographics, with particular concerns around methamphetamine and synthetic opioids driving increased mortality rates. The treatment gap and criminal justice involvement highlight the need for comprehensive public health approaches combining prevention, treatment, and harm reduction strategies.
Statistical Data on Alcohol in Nevada
Nevada ranks third nationally in per capita alcohol consumption, with residents consuming nearly 4 gallons of pure alcohol annually – significantly exceeding the national average of 3 gallons. The state’s alcohol statistics reveal troubling patterns: over half of adults report recent alcohol use, nearly one in four engage in binge drinking, and alcohol use disorders affect more than 330,000 Nevadans. Nevada’s unique position as a tourism and entertainment destination has created an environment where excessive drinking has become normalized, contributing to a public health crisis with consequences reaching across healthcare systems, criminal justice, and economic productivity.
Health Consequences and Deaths
Annual Death Statistics
| Category | Number of Deaths | Percentage |
| Total excessive alcohol deaths (average) | 1,548 | – |
| Deaths in 2020 | 804 | – |
| Deaths in 2021 (preliminary) | 776 | – |
| Male deaths | – | 68.6% |
| Deaths from chronic causes | – | 61.5% |
| Deaths ages 35+ | – | 86.6% |
| Deaths under age 21 | 37 | 2.39% |
The significant year-over-year variation in deaths (24% increase 2019-2020, 3% decrease 2020-2021) may reflect pandemic impacts. The predominance of male deaths (68.6%) and deaths from chronic causes (61.5%) aligns with typical alcohol-related mortality patterns.
Death Rates and Comparisons
- Death rate per 100,000 (2020): 14.3 (above national average of 13.1)
- Death rate per 10,000 adults: 6.43 deaths
- Death ratio: 1 death per 2,006 adults aged 18+
- 5-year increase in death rate (2015-2019): 46.2%
- Age-specific death rate (55-64 years, 2021): 145.6 per 100,000
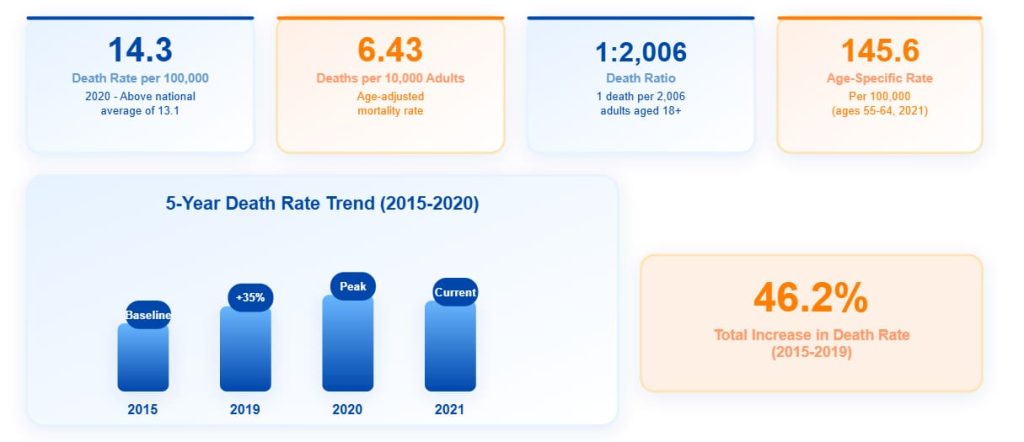
Nevada’s alcohol-related death rate exceeds the national average, with the 46.2% increase over five years representing a public health crisis. The extremely high death rate among 55-64 year-olds (145.6 per 100,000) indicates this age group requires immediate intervention.
Years of Potential Life Lost
- Annual years of potential life lost: 38,880 years
- Years lost from under-21 deaths: 2,125 years
The substantial years of potential life lost (38,880 annually) demonstrates the profound impact of alcohol-related deaths on Nevada’s population, representing decades of lost productivity and family impact.
Overall Alcohol Consumption and Rankings
Nevada’s National Standing
- Alcohol consumption per capita: 3.42 gallons of pure alcohol annually (ranks 3rd nationally)
- National average comparison: Nevada consumption significantly exceeds the national average of 3.0 gallons
- Binge drinking rate: 17.0 of adults (varies by region and measurement criteria)
- National rank for excessive drinking: 27th
Nevada’s position as the third-highest state for alcohol consumption indicates a significant public health concern. The variation in consumption measurements (3.42-4.0 gallons) likely reflects different data collection periods and methodologies, but consistently shows Nevada well above national averages.
Age-Specific Alcohol Use Patterns
Youth (Ages 12-17)
| Measure | Nevada | Regional Average | National Average |
| Past-month alcohol use (2017-2019) | 8.7% | 8.5% | 9.4% |
| Past-month alcohol use (2022-2023) | 8.0% | – | – |
| Ever consumed alcohol (middle school, 2021) | 21.7% | – | – |
| Current alcohol use (middle school, 2021) | 6.4% | – | – |
Youth alcohol use in Nevada has shown positive trends with declining rates. The decrease in middle school current use from 11.7% to 6.4% between 2019-2021 represents a significant improvement in preventing early alcohol initiation.
High School Students
- Current alcohol use (2021): 19.3% (decreased from 26.5% in 2017)
- Rural region usage: 29.3% (significantly higher than state average)
- Risk perception: 37.5% view 5+ drinks as risky (below national average of 43.0%)
The decline in high school alcohol use represents positive progress, though rural areas show concerning higher rates. The lower risk perception compared to national averages suggests need for enhanced education programs.
Young Adults (Ages 18-25)
| Measure | Nevada | Regional Average | National Average |
| Past-month binge drinking (2017-2019) | 32.5% | 33.4% | 35.4% |
| Past-year alcohol use disorder (2017-2019) | 10.7% | 10.2% | 9.8% |
| Current alcohol use (2022-2023) | 52.78% | – | – |
| Current binge drinking (2022-2023) | 27.94% | – | – |
Young adults show the highest rates of problematic alcohol use, with over half reporting current use and more than one-quarter binge drinking. The alcohol use disorder rate slightly exceeds national averages, indicating this age group requires targeted interventions.
Adults (18+ and specific age groups)
| Age Group | Alcohol Use | Binge Drinking | Notes |
| 18+ overall | 51.32% | 24.55% | 2022-2023 data |
| 26+ | 51.11% | 24.09% | 2022-2023 data |
| 18-44 females | 16.5% | – | Binge/heavy drinking, 2021-2022 |
| 65+ | 10.3% | – | Binge/heavy drinking, 2022 |
Adult alcohol use rates remain consistently high across age groups, with binge drinking affecting nearly one-quarter of adults. The lower rate among seniors (65+) reflects typical age-related consumption patterns.
Binge Drinking Patterns
- Monthly binge drinking rate (adults 18+): 16.0%
- Median drinks per binge session: 5.5 drinks
- Top 25% of binge drinkers: 7.8 drinks per session
- Median binge frequency: 1.6 times per month
- Top 25% binge frequency: 3.7 times per month
The binge drinking patterns reveal a concerning intensity of consumption, with the most active drinkers consuming nearly 8 drinks per session multiple times monthly.
Geographic and Demographic Variations
- Statewide binge drinking: 23.4%
- Clark County binge drinking: 25.6%
- Rural region high school alcohol use: 29.3% (vs. 19.3% statewide)
Rural areas show higher rates of youth alcohol use, while urban Clark County shows higher adult binge drinking rates. This suggests different intervention strategies may be needed for urban versus rural populations.
Alcohol Use Disorders and Treatment
Prevalence of Alcohol Use Disorder
| Population | Rate | Number of People |
| Ages 12+ (2017-2019) | 6.2% | 157,000 |
| Ages 12+ (2019) | 6.0% | – |
| Ages 12+ (2020) | 10.2% | – |
| Ages 12+ (2022-2023) | 12.17% | 330,000 |
| Ages 12-20 (2022-2023) | 6.65% | 24,000 |
| Ages 18-25 (2022-2023) | 18.34% | 54,000 |
The dramatic increase in alcohol use disorder prevalence from 6.0% in 2019 to 10.2% in 2020 likely reflects both the impact of the COVID-19 pandemic and improved detection methods. The 2022-2023 rates show continued elevation, particularly concerning among young adults at 18.34%.
Treatment Statistics
- Average age of addiction initiation: 16.1 years
- Alcohol as primary substance in treatment (2019-2021): 13% of admissions
- Treatment admissions (2010): 2,602 for alcohol alone, 1,520 for alcohol with secondary drug
The young age of addiction initiation (16.1 years) underscores the critical importance of prevention programs targeting adolescents. The relatively low percentage of treatment admissions focused on alcohol (13%) suggests potential underutilization of treatment services.
Healthcare Utilization
Emergency Department and Hospital Visits
| Category | Quarterly Numbers (2021) | Annual Estimate |
| Alcohol-related ED visits | 8,600 | 34,400 |
| Drug-related ED visits | 9,300 | 37,200 |
| Alcohol-related inpatient admissions | 5,300 | 21,200 |
| Drug-related inpatient admissions | 8,400 | 33,600 |
Additional Statistics
- Total alcohol/drug-related ED visits (2021): 69,452
- Primary alcohol intoxication cases: 15,550
- Alcohol appearing in substance-related ER visits: 40%
While drug-related visits slightly exceed alcohol-related visits, the near-parity indicates alcohol remains a major healthcare burden. The trend of increasing alcohol ED encounters from 2017-2021 suggests growing acute alcohol-related problems.
Economic Impact
Financial Costs
Cost per alcoholic drink: $2.01
- Total cost to taxpayers (2010): $2.296 billion
- Inflation-adjusted cost (2022): $3.1 billion
- Total state economic impact: $2.3 billion annually
The economic burden of excessive alcohol use represents a significant drain on Nevada’s resources. The cost per drink ($2.01) provides perspective on the true societal cost of alcohol consumption beyond the purchase price.
Alcohol-Related Crime Statistics
- Incarcerated individuals with substance use disorder: 65%
- Under influence during crime commission: 20%
- Fatal crashes involving 15-20 year-old drivers with BAC >0.01% (2022): 12 fatalities (27% of all fatal crashes in this age group)
The high percentage of incarcerated individuals with substance use disorders (65%) demonstrates the strong link between alcohol/substance abuse and criminal behavior. The significant involvement of alcohol in fatal crashes among young drivers (27%) highlights the need for enhanced prevention and enforcement.
Risk Perception and Attitudes
| Age Group | Percentage Viewing 5+ Drinks as High Risk |
| Ages 12+ | 46.55% |
| Ages 12-17 | 39.68% |
| Ages 18-25 | 42.51% |
| Ages 26+ | 47.87% |
| Ages 12-20 | 40.62% |
The relatively low risk perception across all age groups, particularly among youth and young adults, correlates with higher usage rates. The perception that fewer than half of adolescents view heavy drinking as risky indicates need for enhanced education programs.
Nevada’s alcohol statistics reveal a state facing significant challenges with alcohol consumption and related consequences. With consumption rates ranking 3rd nationally, death rates exceeding national averages, and economic costs exceeding $3 billion annually, alcohol abuse represents a major public health crisis. While some positive trends exist, particularly in youth consumption rates, the overall data indicates need for comprehensive intervention strategies targeting prevention, treatment, and harm reduction across all age groups and geographic regions.
In general, Nevada faces a severe dual substance abuse crisis that significantly exceeds national averages across multiple metrics. The state ranks third nationally in alcohol consumption while simultaneously experiencing a 19% increase in drug overdose deaths from 2022 to 2023, with methamphetamine and synthetic opioids driving the majority of fatalities. Despite having adequate treatment infrastructure with 116 active substance abuse clinics, a critical treatment gap persists with over 77% of individuals needing substance use treatment not receiving it, while the economic burden exceeds $3 billion annually. The data reveals that Nevada’s unique position as an entertainment destination has normalized excessive substance use, creating a public health emergency that demands immediate, comprehensive intervention strategies combining prevention, expanded treatment access, and harm reduction approaches to address both the immediate crisis and long-term recovery needs.
Sources:
- Drug Abuse Statistics
- Nevada Addiction Statistics | The Nestled Recovery Center
- Substance Use and Criminality in Nevada: A 2016-2023 Analysis
- 2023 NSDUH SAE State Tabs Nevada
- How many drug overdose deaths happen every year in Nevada? | USAFacts
- Substance Use in Nevada – Data Update
- Updated Drug and Alcohol Statistics for Nevada
- Behavioral Health Barometer: Nevada, Volume 6
- Nevada Substance Abuse Statistics | Recovery Connection
- Explore Excessive Drinking in Nevada | AHR
- Explore Alcohol Use – Youth in Nevada | AHR
- Alcohol Statistics in Nevada
- Report: Nevada alcohol-related deaths among highest in the US (KSNV)