Statistical Data on Drugs in Nebraska
Nebraska presents a complex picture of substance use and its consequences, which is why many people there resort to THC detox. While the state consistently reports lower rates of drug overdose deaths compared to the national average, concerns persist about data accuracy and underreporting. The opioid crisis, methamphetamine epidemic, and marijuana use patterns create significant public health challenges. This report synthesizes available data on drug use prevalence, treatment admissions, overdose deaths, and the criminal justice impact of substance abuse in Nebraska.
Drug Overdose Deaths
Overall Overdose Statistics
Current Statistics (2023)
- Total deaths: 172
- Rate: 9 per 100,000 residents
- 1.23% of all deaths
- 71% lower than US national rate
Historical Deaths
- 2021: 253 deaths
- 2018: 154 deaths
- 2017: 183 deaths
- 2013: 128 deaths
- 2007: 92 deaths
Trends
- 22% increase (2018-2023)
- 38% increase (2013-2023)
- 73% increase (2010-2022)
Geographic Distribution (2023)
| County | Deaths per 100,000 |
| Douglas County | 10.9 |
| Lancaster County | 8.6 |
Death Characteristics (2021)
| Category | Percentage |
| Unintentional overdoses | 85.4% |
| Suicide/intentional overdoses | 12.3% |
| Male deaths | 58.9% |
| Female deaths | 41.1% |
| Highest risk age group | 35-44 years |
| Second highest risk age group | 25-34 years |
Nebraska has experienced significant growth in overdose deaths over recent decades, with synthetic opioids and methamphetamine driving recent increases.
Opioid Crisis
Opioid Overdose Deaths
Current Statistics (2023)
- Total deaths: 78
- Rate: 4.3 per 100,000 residents
- 45.3% of all overdose deaths
- 82.1% lower than US national rate
Historical Deaths
- 2021: At least 127 deaths (50% of 253 total)
- 2018: At least 60 deaths
- 2017: At least 59 confirmed deaths
- 2016: 44 deaths (2.4 per 100,000)
Synthetic Opioid and Fentanyl Deaths
2021-2023 Period
- Total fentanyl/synthetic opioid deaths: 256 Nebraskans
- Deaths in 2021-2022 alone: 138 deaths
Current Impact (2023)
- 78.2% of all opioid deaths involve synthetic opioids
- 35% of total overdose deaths involve fentanyl
Trends
- 2.8 times increase (2010-2023)
- 14% increase (2021-2022)
Prescription Opioid Deaths
- Prescription opioids involved in 30.8% of opioid overdose deaths (2023)
- Opioid pain relievers contributed to 124 deaths (49%) in 2021
- Deaths in 2007 directly attributable to drugs: 92 persons
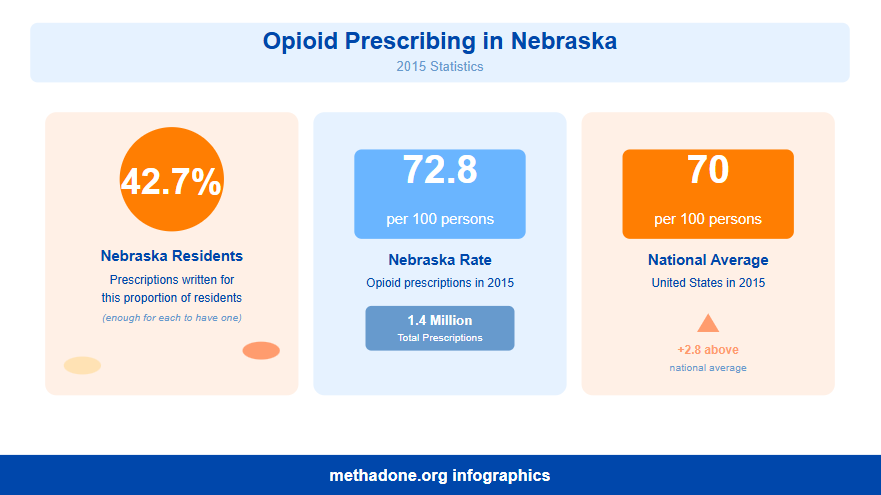
Opioid Prescribing
- Prescriptions written for 42.7% of Nebraska residents (enough for this proportion to have one)
- In 2015: 72.8 opioid prescriptions per 100 persons (1.4 million total prescriptions)
- National average in 2015: 70 opioid prescriptions per 100 persons
Neonatal and Disease Impacts
| Condition | Rate/Statistics |
| Neonatal Opioid Withdrawal syndrome (2020) | 4.4 per 1,000 births |
| Neonatal abstinence syndrome (2001) | 0.2 per 1,000 births |
| Neonatal abstinence syndrome (2013) | 1.6 per 1,000 births (8-fold increase) |
| Hepatitis C linked to IV drug use (2022) | 3.1 new cases estimated |
| HIV/AIDS diagnoses linked to IV drug use (2023) | 6.3 new diagnoses |
Opioids represent nearly half of all overdose deaths in Nebraska, with synthetic opioids like fentanyl becoming increasingly dominant.
Methamphetamine Crisis
Methamphetamine Overdose Deaths
Overdose Rates
- 2019: 2.7 per 100,000 Nebraskans
- 2018: 1.7 per 100,000 Nebraskans
Trends
- 2.1 times increase (2015-2023)
- 21% increase in other psychostimulant
Methamphetamine Use Prevalence
Among Adults (2022-2023)
- Past year use among 12+: 0.96% (16,000 persons)
- Past year use among 18+: 1.05% (15,000 persons)
- Past year use among 18-25: 0.60% (1,000 persons)
- Past year use among 26+: 1.13% (14,000 persons)
Historical Data (2010-2013)
- Past year use among adults 18+: 0.3% (4,000 persons)
- Past year use among 18-25: 1.1%
- Past year use among 26+: 0.2%
Trend Analysis (2002-2013)
- 2002-2005: 1.2% of adults used methamphetamine
- 2010-2013: 0.3% of adults used methamphetamine (significant decrease)
Youth Methamphetamine Use
| Age Group/Year | Percentage |
| High school students lifetime use (2013) | 2.0% |
| 12-17 year-olds past year use (2022-2023) | 0.16% |
Usage and overdose deaths involving methamphetamine have increased substantially, particularly among older adults, with treatment admissions rising over 200% in a decade.
Substance Use Prevalence
Overall Illicit Drug Use (2022-2023)
| Age Group | Past Month Use | Estimated Persons |
| 12+ years | 12.56% | 205,000 |
| 12-17 years | 6.17% | 10,000 |
| 18-25 years | 19.19% | 42,000 |
| 26+ years | 12.27% | 154,000 |
| 18+ years | 13.29% | 195,000 |
Illicit Drug Use Other Than Marijuana (2022-2023)
| Age Group | Past Month Use | Estimated Persons |
| 12+ years | 2.83% | 46,000 |
| 12-17 years | 1.62% | 3,000 |
| 18-25 years | 3.74% | 8,000 |
| 26+ years | 2.84% | 36,000 |
| 18+ years | 2.97% | 44,000 |
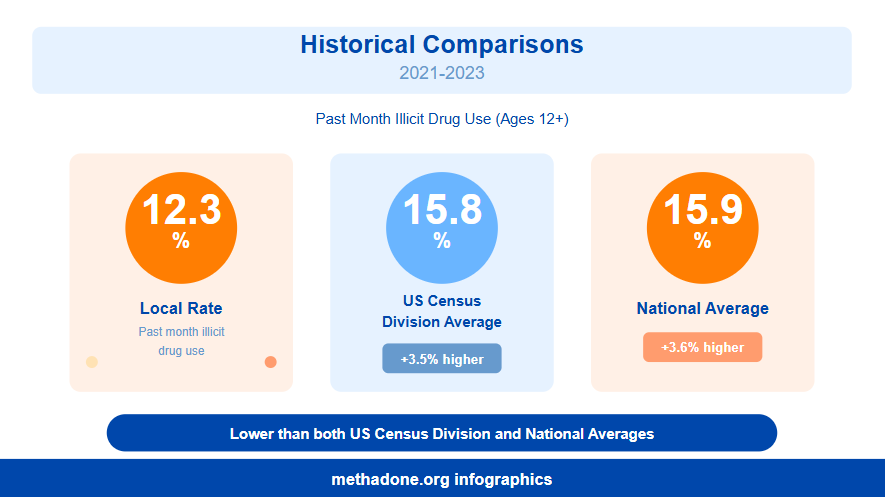
Historical Comparisons
2021-2023
- Past month illicit drug use (12+): 12.3%
- Lower than US census division average (15.8%) and national average (15.9%)
2012-2013
- Approximately 6% of Nebraska residents reported past-month illicit drug use
- National average: 8%
Youth Comparisons
- Nebraska teenagers are 15.03% less likely to have used drugs in the last month than average American teens
- 90% of 12-17 year-olds who used illicit drugs reported marijuana use, and some used detox shampoos to get rid of it
Nebraska consistently reports lower rates of illicit drug use compared to national averages across most age groups.
Marijuana Use
Current Marijuana Use (2022-2023)
| Age Group | Past Month Use | Estimated Persons |
| 12+ years | 11.25% | 184,000 |
| 12-17 years | 5.14% | 9,000 |
| 18-25 years | 19.02% | 41,000 |
| 26+ years | 10.73% | 134,000 |
| 18+ years | 11.94% | 175,000 |
Past Year Marijuana Use (2022-2023)
| Age Group | Past Year Use | Estimated Persons |
| 12+ years | 16.93% | 277,000 |
| 12-17 years | 9.24% | 15,000 |
| 18-25 years | 30.70% | 67,000 |
| 26+ years | 15.57% | 195,000 |
| 18+ years | 17.80% | 261,000 |
First-Time Marijuana Use (2022-2023)
| Age Group | First Use in Past Year | Estimated Persons |
| 12+ years | 2.27% | 23,000 |
| 12-17 years | 3.90% | 6,000 |
| 18-25 years | 6.18% | 9,000 |
| 26+ years | 1.11% | 8,000 |
Historical Data
2021-2023
- Past month marijuana use (12+): 10.9%
- Lower than US census division (14.6%) and national average (14.5%)
2017-2019
- Past year marijuana use (12+): 12.8% (202,000 persons)
- Past year use among 18-25: 34.9% (74,000 persons)
- Past month marijuana use among 12-17: 6.5% (10,000 persons)
2012-2013
- Past month use among adults 18+: 5.4% (74,000 persons)
- Past month use among 18-25: 15.07%
- Past month use among 26+: 3.68%
Youth Marijuana Use (2013 YRBS)
- Past month use among high school students: 11.7% (12,000 youth)
- Lifetime use by grade: 9th (10.2%), 10th (23.5%), 11th (32.0%), 12th (28.2%)
- Early initiation (before age 13): 5.5% (5,000 youth)
- Males: 13.4% past month use
- Females: 9.9% past month use
Marijuana is the most commonly used illicit drug in Nebraska across all age groups, which is why THC detox is also popular there.
Cocaine Use
Cocaine Use Statistics (2022-2023)
| Age Group | Past Year Use | Estimated Persons |
| 12+ years | 1.52% | 25,000 |
| 12-17 years | 0.20% | 0 (negligible) |
| 18-25 years | 3.00% | 7,000 |
| 26+ years | 1.44% | 18,000 |
| 18+ years | 1.67% | 25,000 |
Historical Data
2012-2013
- Past year use among adults 18+: 1.3% (18,000 persons)
- Past year use among 18-25: 3.56%
- Past year use among 26+: 0.93%
Youth Use (2013)
- Lifetime cocaine use among high school students: 3.2% (1 in 31 students)
- By gender: Males 4.4%, Females 2.0%
Cocaine use in Nebraska has remained relatively stable at low levels.
Prescription Drug Misuse
Prescription Pain Reliever Misuse (2022-2023)
| Age Group | Past Year Misuse | Estimated Persons |
| 12+ years | 2.74% | 45,000 |
| 12-17 years | 1.74% | 3,000 |
| 18-25 years | 2.32% | 5,000 |
| 26+ years | 2.94% | 37,000 |
| 18+ years | 2.85% | 42,000 |
Opioid Misuse (2022-2023)
| Age Group | Past Year Misuse | Estimated Persons |
| 12+ years | 2.64% | 43,000 |
| 12-17 years | 1.76% | 3,000 |
| 18-25 years | 2.69% | 6,000 |
| 26+ years | 2.75% | 34,000 |
| 18+ years | 2.74% | 40,000 |
Historical Data
2021-2023
- Opioid misuse among 12+: 2.6%
- Similar to regional average (3.0%), lower than national (3.2%)
2017-2019
Past year pain reliever misuse among 12+: 2.5% (40,000 persons)
2012-2013
- Past year non-medical pain reliever use among 18+: 3.5% (48,000 persons)
- Past year use among 18-25: 7.88%
- Past year use among 26+: 2.74%
Youth Use (2013)
- Lifetime prescription drug use without doctor’s prescription: 10.4% of high school students
- By grade: 9th (4.5%), 10th (8.6%), 11th (14.1%), 12th (13.5%)
Non-Medical Drug Use
- 15.0% of adults reported using prescription drugs non-medically or illicit drugs (excluding cannabis) in past year
- Nebraska ranked 21st nationally
Prescription pain reliever misuse affects a notable percentage of Nebraskans, though rates remain below national averages. Some even detox their hair to mask the problem.
Heroin Use
Heroin Use Statistics (2022-2023)
| Age Group | Past Year Use | Estimated Persons |
| 18-25 years | 0.21% | 0 (negligible) |
| 26+ years | 0.31% | 4,000 |
| 18+ years | 0.29% | 4,000 |
Historical Data
2017-2019
- Past year heroin use among 12+: 0.03% (less than 500 persons)
- Lower than national average (0.30%)
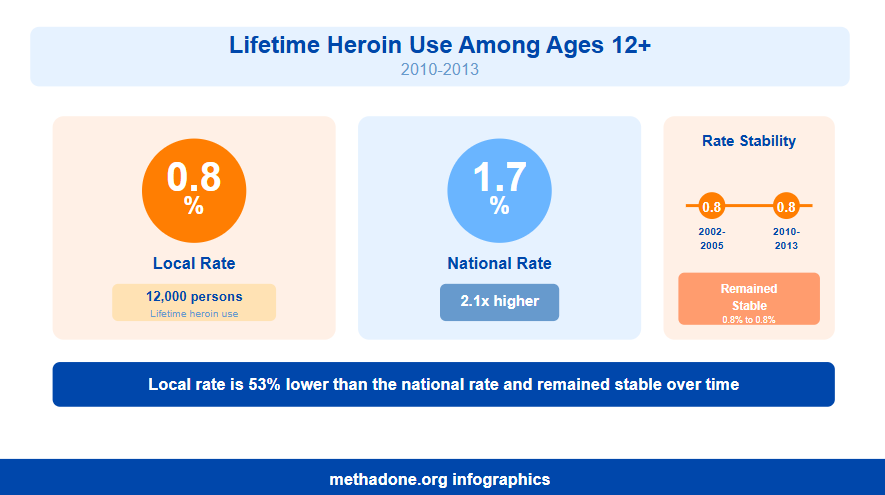
2010-2013
- Lifetime heroin use among 12+: 0.8% (12,000 persons)
- National rate: 1.7%
- Rate remained stable from 2002-2005 (0.8%) to 2010-2013 (0.8%)
Youth Use (2013)
- Lifetime heroin use among high school students: 1.2% (1 in 83 students)
- By gender: Males 1.6%, Females 0.9%
Heroin use remains relatively rare in Nebraska compared to other substances, with rates significantly below national averages.
Substance Use Disorders
Substance Use Disorder (2022-2023)
| Age Group | Past Year SUD | Estimated Persons |
| 12+ years | 16.24% | 266,000 |
| 12-17 years | 7.86% | 13,000 |
| 18-25 years | 26.14% | 57,000 |
| 26+ years | 15.64% | 196,000 |
| 18+ years | 17.19% | 252,000 |
Drug Use Disorder (2022-2023)
| Age Group | Past Year DUD | Estimated Persons |
| 12+ years | 8.13% | 133,000 |
| 12-17 years | 6.50% | 11,000 |
| 18-25 years | 14.75% | 32,000 |
| 26+ years | 7.21% | 90,000 |
| 18+ years | 8.32% | 122,000 |
Specific Drug Use Disorders (2022-2023)
Pain Reliever Use Disorder
- 12+ years: 1.97% (32,000 persons)
- 12-17 years: 1.80% (3,000 persons)
- 18-25 years: 1.12% (2,000 persons)
- 26+ years: 2.14% (27,000 persons)
Opioid Use Disorder
- 12+ years: 2.04% (33,000 persons)
- 12-17 years: 1.79% (3,000 persons)
- 18-25 years: 1.23% (3,000 persons)
- 26+ years: 2.21% (28,000 persons)
A substantial portion of Nebraska’s population struggles with substance use disorders (and use THC detox), they affect over 8% of the population aged 12 and older.
Substance Use Treatment
Treatment Capacity and Utilization
| Metric | Value |
| Active substance abuse clinics | 137 facilities |
| Clients serviced annually | 5,868 persons |
| Outpatient services enrollment (annual) | 4,982 clients |
| Residential (non-hospital) services enrollment (annual) | 883 clients |
| Hospital-based drug rehab patients | 3 clients |
| Facilities offering free treatment | 3 facilities |
Treatment Receipt (2022-2023)
| Age Group | Received Treatment | Estimated Persons |
| 12+ years | 4.45% | 73,000 |
| 12-17 years | 4.69% | 8,000 |
| 18-25 years | 5.04% | 11,000 |
| 26+ years | 4.32% | 54,000 |
| 18+ years | 4.43% | 65,000 |
Treatment Need (2022-2023)
| Age Group | Needing Treatment | Not Receiving Treatment |
| 12+ years | 18.02% (295,000) | 75.19% (220,000) |
| 12-17 years | 11.22% (19,000) | 57.04% (10,000) |
| 18-25 years | 27.71% (60,000) | 82.58% (50,000) |
| 26+ years | 17.25% (216,000) | 74.67% (160,000) |
| 18+ years | 18.79% (276,000) | 76.42% (210,000) |
Historical Treatment Data
2012-2013
Persons needing but not receiving treatment: 2.3% (35,000 persons)
Single-Day Count (March 2019)
Total enrolled in treatment: 5,868 people (increased from 5,735 in 2015)
- Drug problem only: 29.8%
- Alcohol problem only: 21.3%
- Both drug and alcohol problems: 48.9%
Treatment Admissions by Primary Drug (2014)
| Drug | Percentage | Number of Admissions |
| Methamphetamine | 13.9% | Primary in 8,255 admissions where drug was primary |
| Marijuana | 10.1% | – |
| Other opiates | 5.0% | – |
| Cocaine | 1.4% | – |
Total Treatment Admissions
- 2014: 21,792 admissions among 12,494 individuals
- 2010: 15,729 people entered rehab for alcohol and drug addiction (Males 72%, Females 28%)
Demographics of Treatment Admissions (2014)
By Gender
- Males: 66.2% (8,275 persons)
- Females: 33.8% (4,219 persons)
By Age
- 12-17: 1.6% (201 persons)
- 18-20: 7.2% (903 persons)
- 21-24: 15.9% (1,987 persons)
- 25-34: 32.8% (4,095 persons)
- 35-44: 20.1% (2,514 persons)
- 45-54: 15.5% (1,934 persons)
- 55-64: 6.1% (764 persons)
- 65+: 0.7% (93 persons)
By Race/Ethnicity
- Non-Hispanic White: 74.6% (9,318 persons)
- Hispanic: 9.2% (1,148 persons)
- Non-Hispanic Black: 8.5% (1,066 persons)
- Non-Hispanic Native American/Native Hawaiian: 3.7% (451 persons)
- Non-Hispanic Asian: 0.7% (93 persons)
- Non-Hispanic Multi-Racial: 0.5% (60 persons)
By Urban/Rural Residence
- Large Urban: 60.3% (7,422 persons)
- Small Urban: 27.8% (3,424 persons)
- Rural: 11.9% (1,465 persons)
Medication-Assisted Treatment (MAT)
Methadone (Single-Day Count, March 2019)
Patients receiving methadone in opioid treatment programs: 645 people (increased from 619 in 2015)
Buprenorphine (Single-Day Count, March 2019)
Patients receiving buprenorphine: 492 people (increased from 52 in 2015)
Nebraska has 137 active substance abuse clinics serving thousands annually. However, a significant treatment gap exists, with three-quarters of those needing treatment not receiving it.
Treatment Costs
| Service Type | Average Individual Cost | Total Public Spending | U.S. Percentage |
| Residential (non-hospital) | $58,777 per person | $51.9 million | 1.0% of U.S. total |
| Outpatient | $1,855 per person | $9.24 million | 0.4% of U.S. total |
Rankings
- Nebraska ranks 40th for cost of residential drug abuse treatment (non-hospital)
- Nebraska is among the top 10 most expensive states for outpatient drug rehabilitation services
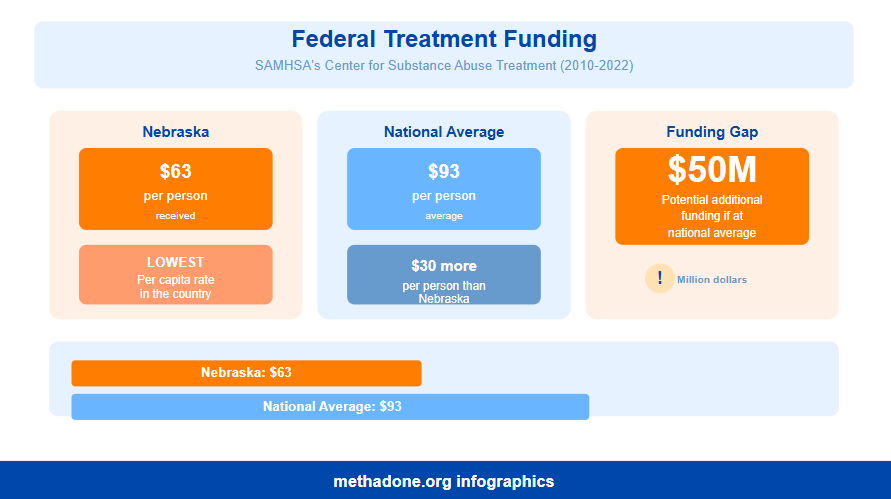
Federal Treatment Funding
- Nebraska received approximately $63 per person from SAMHSA’s Center for Substance Abuse Treatment (2010-2022)
- National average: $93 per person
- Lowest per capita rate in the country
- Potential additional funding if at national average: $50 million
Nebraska ranks as one of the more expensive states for drug rehabilitation services, particularly for outpatient care, despite having lower than average overdose rates.
Driving Under the Influence of Drugs
Drug Recognition Expert (DRE) Examinations (2014)
- Total persons examined: 671
- Completed toxicology tests: 550 (82% completion rate)
- Persons examined (2012): 595
Substances Detected (2014, Percentage of Completed Tests)
| Substance | Number | Percentage |
| Marijuana | 314 | 52.2% |
| Depressants | 164 | 27.2% |
| Stimulants | 100 | 16.6% |
| Narcotics | 73 | 12.1% |
| Other drugs | 20 | 3.3% |
Trends (2012-2014)
- Marijuana: 54.4% (2012) to 52.2% (2014) – Stable
- Stimulants: 23.3% (2012) to 16.6% (2014) – Decreased
- Narcotics and Depressants: Remained stable
- Other drugs: Stable at 3-4%
The number of suspected drug-impaired drivers examined has increased slightly from 2012 to 2014.
Criminal Justice Impact
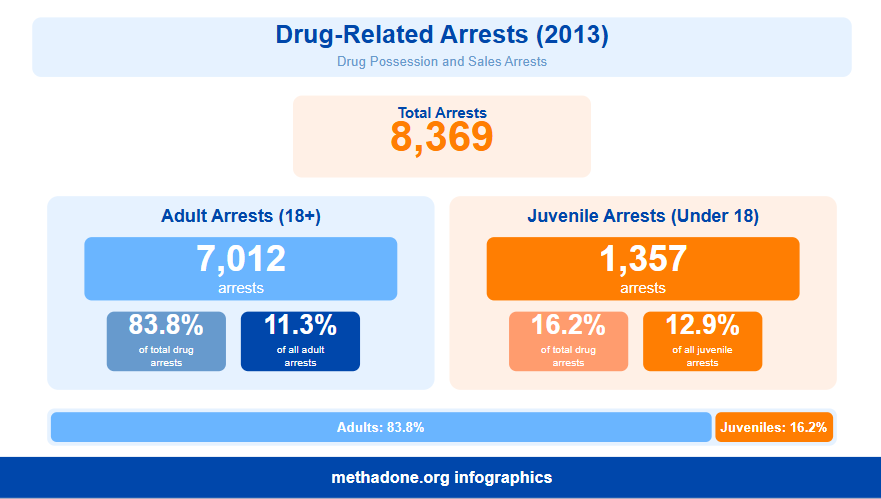
Drug-Related Arrests (2013)
- Total drug possession/sales arrests: 8,369
- Adult arrests (18+): 7,012 (83.8%)
- Juvenile arrests (under 18): 1,357 (16.2%)
- Percentage of all adult arrests: 11.3%
- Percentage of all juvenile arrests: 12.9%
Incarceration for Drug-Related Crime
Overall Incarceration
- Drug offense inmates (2014): 714 individuals
- Drug offense inmates (2012): 637 individuals
- Annual cost to maintain drug offense inmates: approximately $20 million
Drug-related offenses place substantial strain on Nebraska’s criminal justice system.
Nebraska’s drug statistics reveal a state with lower-than-average overdose death rates but significant underreporting concerns. The opioid crisis, while less severe than nationally, continues to impact the state with synthetic opioids increasingly involved. The state faces challenges including inadequate federal funding for treatment, and a substantial treatment gap where three-quarters of those needing help do not receive it. While youth drug use rates remain below national averages, substance use disorders affect approximately 16% of the population aged 12 and older, demonstrating the ongoing need for comprehensive prevention, treatment (like THC detox), and recovery services.
Statistical Data on Alcohol in Nebraska
Nebraska faces significant challenges related to alcohol consumption and its consequences. The state consistently ranks above the national average in several key alcohol-related metrics, particularly in binge drinking rates among adults and young adults. This comprehensive statistical overview examines alcohol consumption patterns, health consequences, mortality rates, economic impacts, and demographic variations across Nebraska’s population. The data reveals a complex public health issue that affects Nebraskans across all age groups, with particularly high rates among young adults aged 18-25 and significant gender disparities in drinking patterns and consequences.
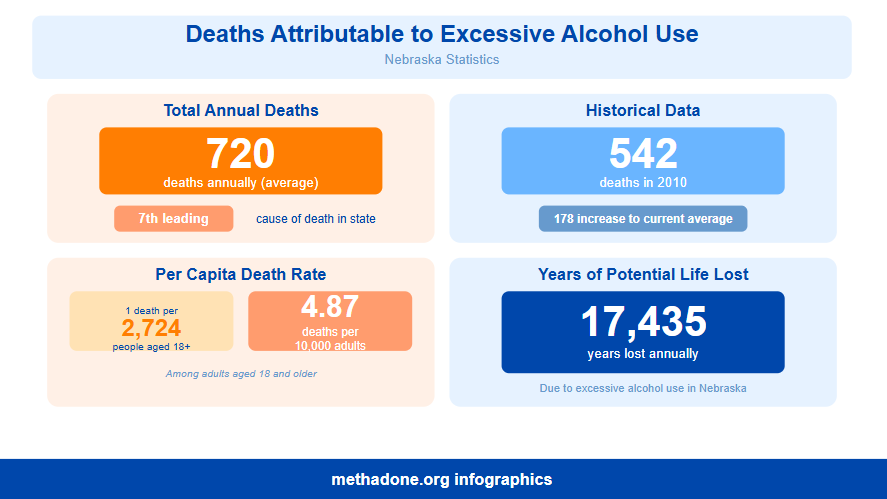
Overall Alcohol-Related Deaths and Burden
- Total Annual Deaths: An average of 720 deaths in Nebraska are attributable to excessive alcohol use annually, making it the 7th most common cause of death in the state (2010 data showed 542 deaths).
- Per Capita Death Rate: Nebraska averages one death from excessive alcohol use for every 2,724 people aged 18 and older, or 4.87 deaths for every 10,000 adults.
- Years of Potential Life Lost: 17,435 years of potential life is lost to excessive alcohol use each year in Nebraska.
Percentage of Deaths by Age
- 85.4% of deaths from excessive alcohol use are adults aged 35 years and older
- 3.06% of people who die from excessive alcohol use are under the age of 21
Deaths by Gender
- 68.2% of people who die from excessive alcohol use in Nebraska are male
- 31.8% are female
Deaths by Cause Type
- 66.1% of excessive alcohol use deaths are from chronic causes, such as Alcohol Use Disorder
- 33.9% are from acute causes
Five-Year Trend: The 5-year average annual rate of excessive alcohol deaths per capita in Nebraska increased by as much as 52.1% from 2015 to 2019.
This dramatic increase of over 50% in just five years represents a critical escalation in the alcohol-related mortality crisis.
Alcohol-Related Mortality by Specific Causes
Chronic Liver Disease (2013)
- Deaths: 181 deaths
- Age-Adjusted Rate: 8.9 per 100,000
- National Comparison: Nebraska’s rate (8.9) was lower than national rate (10.2).
Trend (2008-2013)
- 2008: 7.1 rate (134 deaths)
- 2013: 8.9 rate (181 deaths)
- Trend: Increasing
By Race/Ethnicity
- Native Americans: 57.5%
- Hispanics: 12.4%
- Whites: 7.2%
The dramatic disparities by race indicate targeted interventions are needed for Native American and Hispanic populations.
Mortality Trends 2021-2022
Percentage Change in Age-Adjusted Death Rate (2021 to 2022)
| Cause | Nebraska | U.S. |
| Combined alcohol, drug, and suicide | -5% | -1% |
| Alcohol-induced | +3% | -6% |
| Suicide | +4% | +1% |
While the U.S. saw a decrease in alcohol-induced mortality, Nebraska experienced an increase.
Adult Alcohol Consumption Patterns
Binge Drinking
- Current Rates (2014): 20.3% of Nebraska adults (287,000 adults) reported binge drinking in the past 30 days.
- National Comparison: Nebraska’s rate (20.3%) was significantly higher than the national average (16.0%).
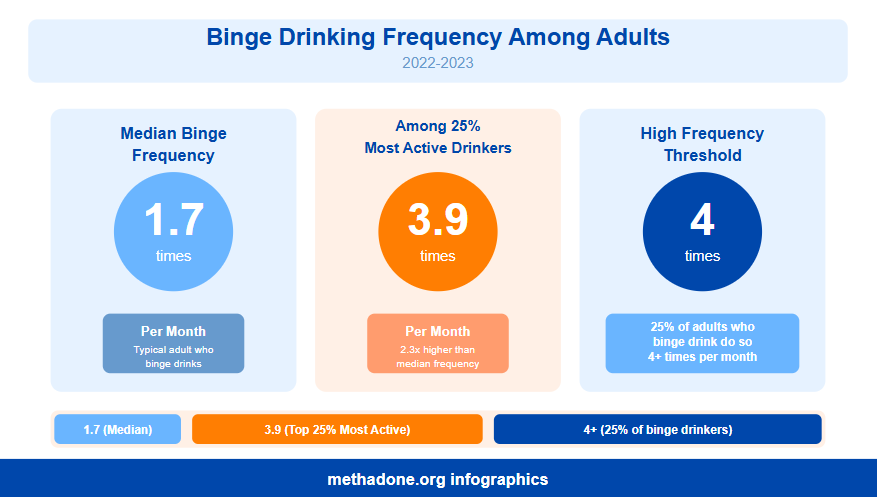
Binge Drinking Frequency Among Adults (2022-2023)
- Median binge frequency: 1.7 times monthly
- Among the 25% most active drinkers: 3.9 times per month
- 25% of adults who binge drink do so four times per month
Drinks Per Binge
- Median drinks per binge: 5.6
- Among the 25% most active drinkers: 8.0 drinks per binge
Nebraska’s binge drinking rate exceeds the national average by 4.3 percentage points, placing the state among the worst performers nationally.
Demographic Variations in Binge Drinking
By Age
- 18-24 years: Highest risk group
- 25-34 years: 34.6% (highest rate)
- 35-44 years: 25.5%
- 85 and older: 0.6% (lowest rate)
By Gender
- Males: 27.8%
- Females: 15.1%
Males are nearly twice as likely to binge drink as females.
Heavy Alcohol Use
- Current Rate (2014): 6.4% of Nebraska adults (91,000 adults) reported heavy drinking in the past 30 days.
- National Comparison: Nebraska’s rate (6.4%) was similar to the national rate (5.9%), though Nebraska had significantly higher rates in 2011 and 2012.

Demographic Variations in Heavy Drinking
By Age
- 18-24 years: 9.9%
- 35-44 years: 7.0%
- 85 and older: 1.7%
By Gender
- Males: 8.1%
- Females: 5.9%
By Race/Ethnicity (2011-2014, Age-Adjusted)
- Multiracial: 9.2%
- Hispanic: 4.3%
- Asian: 3.8%
- Other race: 3.6%
The percentage of Nebraska adults reporting heavy alcohol use showed a decline from 2011 to 2014.
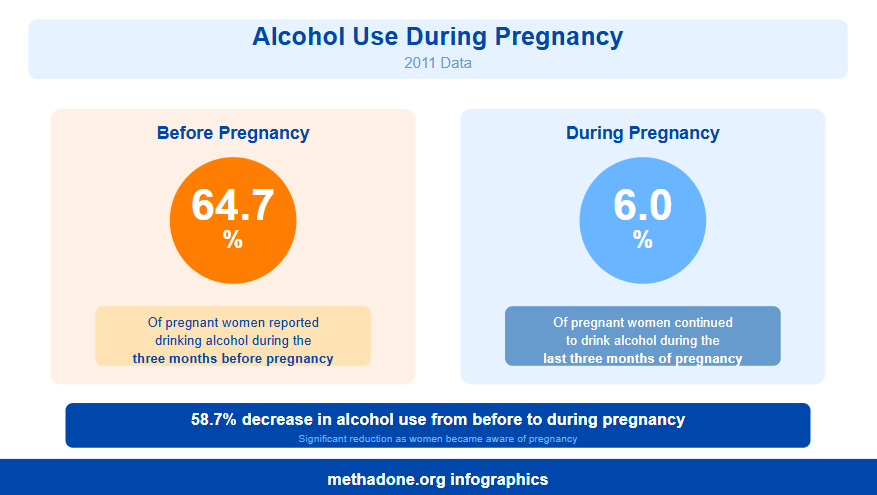
Alcohol Use During Pregnancy
- Before Pregnancy (2011): 64.7% of pregnant women reported drinking alcohol during the three months before pregnancy.
- During Pregnancy (2011): 6.0% of pregnant women continued to drink alcohol during the last three months of pregnancy.
This exceptionally high rate ranked Nebraska fifth among 25 states participating in the Pregnancy Risk Assessment Monitoring System (PRAMS) survey, n.
Young Adult Alcohol Consumption (Ages 19-25)
Current Alcohol Use
By Age Group
- 23-25 years: 78.0%
- 21-22 years: 75.7%
- 19-20 years: 47.9%
By Gender
- Males: 67.9%
- Females: 68.4%
While men and women drink at similar rates, consumption patterns differ.
Binge Drinking Among Young Adults
- Overall Rate (2013): 44.9% of young adults (84,000 individuals) reported binge drinking in the past month.
- Among Past-Month Drinkers: 66.3% reported binge drinking (2 in 3 young adults who drink).
- Frequent Binge Drinking: 33.0% (62,000 young adults) reported binge drinking more than once per month.
- National Comparison (2017-2019): Nebraska’s rate of 41.8% was higher than the national average of 35.4%.
Drinks Per Episode
- 18-24 years: 8.1 drinks average
- 25-34 years: 8.3 drinks average
- Overall average: 7.2 drinks
Demographic Variations
By Age
- 21-22 years: 51.7%
- 23-25 years: 49.0%
- 19-20 years: 33.3%
By Gender
- Males: 45.9%
- Females: 43.9%
- Binge drinking more than once per month: Males 35.7%, Females 30.2%
Young adults show the highest binge drinking rates of any age group in Nebraska, with nearly half engaging in this risky behavior
Youth Alcohol Consumption (Grades 9-12)
Binge Drinking Among Youth (2013)
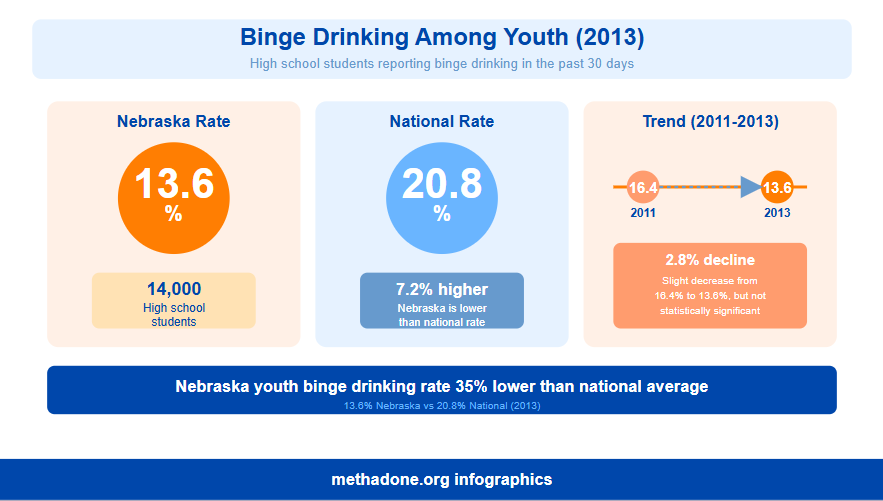
- Rate: 13.6% of high school students (14,000 youth) reported binge drinking in the past 30 days.
- National Comparison: Nebraska (13.6%) was lower than national rate (20.8%).
- Trend: Slight decline from 16.4% (2011) to 13.6% (2013), but not statistically significant.
Recent Data by Grade (2023)
| Grade | Male | Female |
| 9th | 3.4% | 3.8% |
| 10th | 3.7% | 1.8% |
| 11th | 6.4% | 4.0% |
| 12th | 3.1% | 7.2% |
Recent Data for Ages 19-22 (2022):
| Age Group | Male | Female |
| 19-20 years | 16.8% | 13.7% |
| 21-22 years | 37.7% | 35.6% |
Youth binge drinking rates show significant improvement compared to national averages.
Heavy Drinking Among Youth (2013)
- Rate: 3.8% of high school students (4,000 youth) reported heavy drinking (10+ drinks in a row) in the past 30 days.
- National Comparison: Nebraska (3.8%) was slightly but not significantly lower than national rate (6.1%).
By Grade
- 9th grade: 0.9%
- 12th grade: 5.3% (five times higher)
By Gender
- Males: 5.4% (significantly higher)
- Females: 2.0%
This is the only youth alcohol metric showing significant gender disparity, with males consuming at much higher quantities.
Alcohol Dependence and Treatment
Alcohol Use Disorder (2021-2023)
- Rate (Ages 12+): 11.5% had alcohol use disorder in the past year
- National Comparison: Similar to census division average (11.3%) and national average (10.4%)
Earlier Data (2022-2023, Ages 12+)
- Ages 12+: 185,000 people (11.33%)
- Ages 12-17: 5,000 (2.82%)
- Ages 18-25: 36,000 (16.46%)
- Ages 26+: 145,000 (11.57%)
Need for Treatment (2012-2013)
- Rate: 7.6% (116,000 Nebraskans ages 12+) needed treatment for alcohol but did not receive any
- National Comparison: Higher than national rate (6.4%), but difference was non-significant
- Trend: Both Nebraska and U.S. saw decreases, though Nebraska’s was steeper, followed by an increase starting in 2012.
Treatment Admissions (2014)
- Total Substance Abuse Admissions: 13,537 admissions (12,494 individuals)
- Alcohol as Primary Drug: 62.1% of adult admissions
- Alcohol in Top Three Drugs: 77.4% of all admissions
- Trend: Alcohol remained primary drug from 2011 (69.7%) to 2014 (62.1%), though slightly decreased
By Gender
- Males reporting alcohol as primary: 67.8%
- Females reporting alcohol as primary: 50.6%
- Males reporting alcohol in top three: 81.6%
- Females reporting alcohol in top three: 68.8%
Historical Context (2006-2010)
- 2010: 9,729 entered treatment for alcohol only
- 2010: 2,580 entered for alcohol combined with secondary drug
- Trend: Both categories increasing since 2006
Alcohol remains the overwhelmingly dominant substance in Nebraska treatment admissions.
Alcohol Consumption and Sales
Alcohol Sales Trend
- 2000: 22,288 gallons per 10,000 population (ages 14+)
- 2010: 23,136 gallons per 10,000 population
- National average (2010): 22,608 gallons per 10,000 population
Nebraska’s per capita alcohol sales are 2.3% higher than the national average and have increased 3.8% since 2000.
Economic Costs
- Total Annual Cost (2010): $1.167 billion
- Adjusted for Inflation (2022): $1.575 billion
- Cost Per Drink: $2.17 (in 2022 US dollars)
- Government Burden (2010): $491 million (approximately 42% of total costs)
- Binge Drinking Contribution: 75% of total costs attributable to binge drinking
- Underage Drinking Cost (2013): $324.5 million, including: medical care, work loss, pain and suffering
- Cost Per Youth: $1,779 for each youth in the state
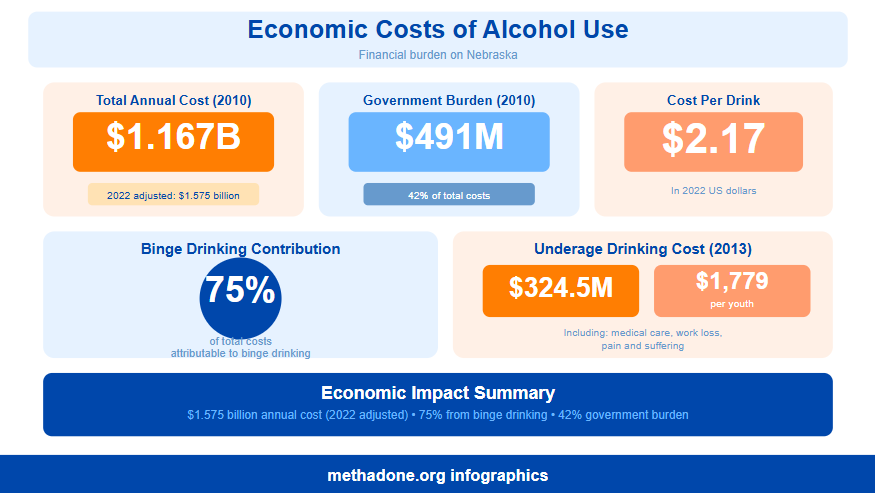
The economic burden of alcohol abuse in Nebraska is substantial, with taxpayers bearing a significant portion.
The data reveals that alcohol abuse in Nebraska represents a multifaceted public health crisis affecting all demographics, with particularly severe impacts on young adults, males, and certain racial/ethnic groups. While youth consumption shows improvement, adult binge drinking rates remain persistently high and above national averages. The 52.1% increase in alcohol-related deaths from 2015 to 2019 indicates an escalating emergency requiring comprehensive intervention strategies targeting prevention, treatment access, and enforcement.
Conclusion
In general, Nebraska faces a dual substance abuse crisis that demands urgent attention. While the state reports lower drug overdose rates than the national average, alcohol-related deaths increased by 52.1% from 2015 to 2019, with binge drinking rates ranking among the worst nationally. The treatment gap is substantial—three-quarters of those needing substance abuse treatment do not receive it, despite the combined economic burden exceeding $1.5 billion annually. Young adults aged 18-25 emerge as the highest-risk population across nearly all metrics, with particularly concerning rates of binge drinking (44.9%), and substance use disorders (26.14%), underscoring the critical need for targeted prevention and intervention strategies for this demographic.
Sources:
- Drug Abuse Statistics
- NEBRASKA DRUG CONTROL UPDATE Drug Use Trends in Nebraska Substance Abuse Treatment Admissions Data
- NEBRASKA – National Survey on Drug Use and Health
- Nebraska Drug Overdose Deaths Fact Sheet for 2021
- Explore Non-Medical Drug Use – Past Year in Nebraska | AHR
- We don’t know the real number of Nebraskans dying from drugs. It’s costing us | Nebraska Public Media
- Nebraska Statistics On Drug Abuse | Recovery Connection
- Pain in the Nation: The Epidemics of Alcohol, Drug, and Suicide Deaths: Snapshot for Nebraska
- An Epidemiological Profile
- Nebraska Coalition to Prevent Opioid Abuse Releases Report on Progress
- Nebraska Opioid Summary
- OPIOID ADDICTION 2023
- Study shows meth usage on the rise in Nebraska
- How many drug overdose deaths happen every year in Nebraska? | USAFacts
- Behavioral Health Barometer Nebraska | Volume 8
- Behavioral Health Barometer: Nebraska, Volume 6
- The Facts about Binge Drinking