Statistical Data on Drugs in Montana
Montana faces significant challenges with substance abuse and drug overdose deaths. The state consistently ranks above national averages for illicit drug use across multiple age groups, with particularly concerning rates among youth and young adults. While Montana’s overdose death rate remains below the national average, the state has experienced substantial increases in deaths involving fentanyl and methamphetamine. American Indian populations are disproportionately affected, and the opioid epidemic continues to impact communities statewide, based on various survey methods, including hair drug testing. This comprehensive statistical overview draws from state health department data, treatment facility records, and epidemiological surveillance to provide a detailed picture of Montana’s substance use landscape.
Drug Overdose Deaths
Overall Mortality Statistics
- 208 drug overdose deaths per year (current reporting period)
- 1.86% of all deaths are from drug overdose
- Overdose deaths increased by 37.59% over the last 3 years
- 19.4 deaths per 100,000 residents (46.79% less than national rate)
- 0.19% of nationwide overdose deaths occur in Montana
- Drug overdoses are the 4th leading cause of injury death in Montana
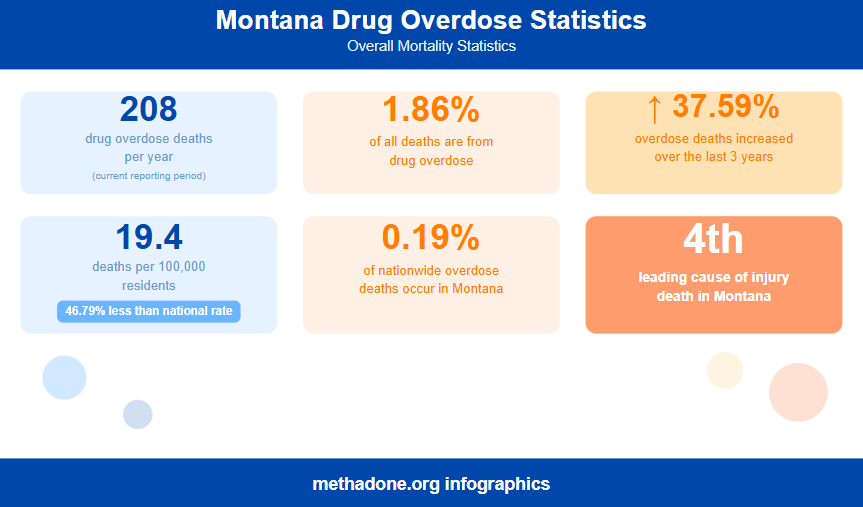
While Montana’s overdose death rate remains below the national average, the 37.59% increase over three years indicates a worsening crisis. The state’s position as the fourth leading cause of injury death underscores the public health significance of this issue.
Historical Trends (2014-2023)
- 1,501 total drug overdose deaths between 2014-2023
- Average of 150 drug overdose deaths per year
- Death rate increased 37% from 12.2 per 100k (2014) to 16.7 per 100k (2023)
- Most increases occurred 2018-2021
- Rates stabilized 2021-2023
The decade-long trend shows a clear escalation in overdose mortality, with the most dramatic increases coinciding with the COVID-19 pandemic period. Recent stabilization suggests interventions may be having an effect, though rates remain elevated.
Comparison to Other Causes of Death
| Year | Drug Overdose Deaths | Motor Vehicle Deaths | Firearm Deaths |
| 2007 | 132 | 268 | 139 |
| 2009 | 147 | 227 | 166 |
| 2014-2023 | 1,501 total | 1,930 total | 2,244 total |
Additional Context
- Drug overdoses (1,501) vs. Unintentional falls (1,912) between 2014-2023
Drug overdose deaths have become comparable to traditional injury categories like motor vehicle crashes, reflecting the severity of the substance abuse crisis.
Drug Types Involved in Overdose Deaths
10-Year Totals by Drug Type (2014-2023)
| Drug Type | Total Deaths | Rate per 100k |
| All opioids | 728 | 7.2 |
| All stimulants | 511 | 5.2 |
| Heroin | 123 | 1.3 |
| Fentanyl | 323 | 3.3 |
| Methamphetamine | 487 | 4.9 |
| Codeine/morphine/other opioids | 241 | 2.2 |
| Benzodiazepines | 115 | 1.1 |
| Other/unspecified antidepressants | 132 | 1.2 |
| Methadone | 76 | 0.8 |
| Cocaine | 37 | 0.4 |
Opioids and stimulants (primarily methamphetamine) dominate Montana’s overdose deaths, with synthetic opioids (fentanyl) showing the most dramatic recent increases.
Polydrug Deaths
- 55.2% of deaths involved at least two drugs (2019-2023)
- Multiple drug deaths became more common than single drug deaths after 2018
Number of Drugs Involved (2019-2023)
- 1 drug: 44.8% (387 deaths)
- 2 drugs: 25.7% (222 deaths)
- 3 drugs: 15.4% (133 deaths)
- 4 drugs: 7.4% (64 deaths)
- 5+ drugs: 6.6% (57 deaths)
The majority of recent overdose deaths involve multiple substances, complicating both prevention and treatment efforts. This trend reflects increasingly adulterated drug supplies.
Opioid Epidemic
Opioid Overdose Deaths
- 129 opioid overdose deaths in 2023
- Opioids are a factor in 68.6% of all overdose deaths
- 12.0 deaths per 100,000 residents (50.0% less than national rate)
- Opioid deaths increased 117% from 5.2 per 100k (2014) to 11.3 per 100k (2023)
Despite having half the national opioid overdose death rate, Montana has experienced more than a doubling of opioid-related mortality over the past decade, indicating growing availability and use of opioids.
Fentanyl Crisis
- Synthetic opioids (fentanyl) involved in 76.7% of opioid overdose deaths
- 62 fentanyl overdose deaths in 2021
- 30% of fatal overdoses involved fentanyl in 2021 (14% increase from 2020)
- Fentanyl death rate tripled from 2.7 per 100k (2020) to 8.9 per 100k (2023)
- 12,079 fentanyl pills seized between January 1-March 15, 2022 (more than 3x all of 2021)
The explosive growth in fentanyl-related deaths and seizures represents the most alarming trend in Montana’s overdose epidemic. The tripling of the death rate in just three years demonstrates fentanyl’s rapid infiltration into the drug Supply.
Prescription Opioids
- 19.4% of opioid overdose deaths involve prescription opioids
- 181 deaths linked to prescription opioids from 2012-2015
- 359 prescription drug overdose deaths from 2011-2013
- Doctors write enough prescriptions for 40.4% of residents
- 21.5 per 1,000 births diagnosed with neonatal Opioid Withdrawal syndrome (2020)
While prescription opioid deaths represent a smaller proportion of total opioid deaths compared to fentanyl, the high prescribing rate and neonatal withdrawal cases indicate ongoing issues with prescription opioid exposure.
Age Distribution of Opioid Deaths
2021 Data
- Adults aged 25-44: 58% of deaths
- Adults aged 45-64: 38% of deaths
- Males: 66% of deaths
Fentanyl-Specific (2021)
- Adults aged 25-44: 73% of deaths
- Adults aged 45-64: 21% of deaths
- Males: 71% of deaths
Young and middle-aged adults bear the brunt of both opioid and fentanyl mortality, with males disproportionately affected. Fentanyl deaths skew even younger than overall opioid deaths.
Health Consequences
- 16.1 new hepatitis C cases per 100k linked to IV drug use (2022)
- 1.9 new HIV/AIDS diagnoses per 100k connected to IV drug use (2023)
- Nearly $5 million charged by Montana hospitals for opioid-related hospitalizations and ED visits (2021)
Beyond mortality, opioid use drives infectious disease transmission and significant healthcare costs, creating broader public health and economic impacts.
Methamphetamine and Stimulants
Methamphetamine Deaths and Trends
- Stimulant deaths increased from 3.1 per 100k (2014) to 8.2 per 100k (2023)
- Methamphetamine deaths: 3.1 per 100k (2014) to 8.2 per 100k (2023)
- 53% of DCI drug investigations in 2016 were meth-related
- 427% increase in methamphetamine violations between 2010-2015
- 475% increase in heroin use since 2013
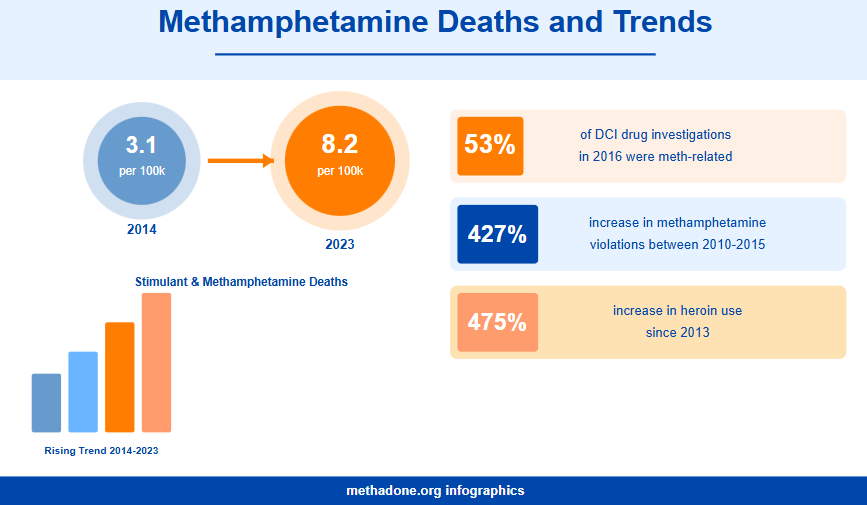
Methamphetamine represents Montana’s other major drug crisis, with death rates nearly matching opioids. The dramatic increase in violations suggests widespread availability and use.
Methamphetamine Characteristics
- Seizures and purity levels continue to increase
- Firearms commonly found on offenders
- Transported via Interstates 15, 25, and 90
- Most commonly concealed in private or rental vehicles
The association with firearms and interstate trafficking routes indicates organized distribution networks and potential for violence.
Demographics of Overdose Deaths
Race and Ethnicity
- American Indian/Alaska Native death rate: 52.5 per 100k (2019-2023)
- Over 3x the state rate of 16.9 per 100k
- White death rate: 13.0 per 100k (2014-2023)
- 234 American Indian deaths total (2014-2023)
- 1,231 White deaths total (2014-2023)
American Indian populations experience vastly disproportionate overdose mortality, representing one of the most severe health disparities in the state. This requires culturally-specific interventions and enhanced resources.
Age Groups (2019-2023)
| Age Group | Death Rate per 100k | Total Deaths (2014-2023) |
| ≤24 years | 3.3 | 108 |
| 25-44 years | 30.1 | 675 |
| 45-64 years | 24.4 | 594 |
| 65+ years | 6.2 | 124 |
Working-age adults (25-64) account for the vast majority of overdose deaths, representing lost productivity and family disruption. The relatively low rate among youth suggests prevention efforts may be effective for this group.
Gender
- Male death rate: 21.2 per 100k (2019-2023)
- Female death rate: 11.9 per 100k (2014-2023)
- Males: 878 deaths (2014-2023)
- Females: 623 deaths (2014-2023)
- Males account for 66% of opioid deaths (2021)
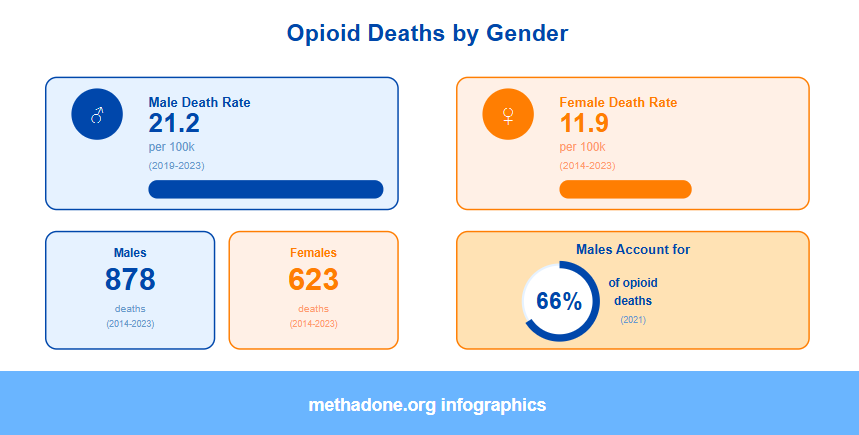
Males die from overdoses at nearly twice the rate of females, consistent with national patterns and reflecting gender differences in substance use behaviors and risk-taking.
Intent of Overdose
| Intent | Percentage | Rate per 100k (2014-2023) |
| Unintentional | 78.8% | 11.6 |
| Suicide | 14.4% | 1.9 |
| Undetermined | 6.8% | 1.0 |
- Unintentional deaths increased from 7.4 per 100k (2014) to 15.0 per 100k (2023)
- Suicide deaths declined from 2.9 per 100k (2014) to 2.2 per 100k (2020)
The overwhelming majority of overdose deaths are unintentional, suggesting victims underestimated drug potency or were unaware of adulteration. The increase in unintentional deaths contrasts with declining suicide deaths.
County-Level Data
Highest Overdose Death Rates by County (2019-2023)
| County | Death Rate per 100k | Deaths |
| Silver Bow | 38.7 | 66 |
| Lake | 33.6 | 45 |
| Yellowstone | 23.5 | 187 |
| Park | 21.2 | 20 |
| Cascade | 16.7 | 62 |
| Missoula | 16.0 | 95 |
| Flathead | 14.7 | 79 |
| Lewis & Clark | 14.0 | 47 |
| Ravalli | 9.9 | 23 |
| Gallatin | 8.5 | 54 |
Silver Bow County’s rate more than doubles the state average, indicating severe localized crisis. Urban counties (Yellowstone, Missoula) have high total deaths but moderate rates, while some rural counties face disproportionate impacts.
Nonresident Deaths
- 50 nonresident overdose deaths (2014-2023)
- Most common state of residence: Wyoming (18%)
The small number of nonresident deaths suggests Montana’s overdose problem primarily affects residents rather than visitors or transients.
Historical Context and Long-Term Trends
Rate of Change Analysis (2000-2018)
- Overdose death rate: 171% increase (4 to 12 per 100k)
- First low in 15 years occurred in 2015
- Drug-induced death rate (15.1 per 100k in 2009) exceeded national rate (12.8 per 100k)

Drug Use Rankings (2009-2010)
Montana ranked in top 10 states for:
- Past-month illicit drug use (ages 12-17)
- Past-month marijuana use (ages 12+)
- Past-month marijuana use (ages 12-17)
- Past-month illicit drug dependence/abuse (ages 12-17)
Montana’s long-standing position among highest-use states indicates persistent structural and cultural factors driving substance use, not just recent trends.
Emergency Department and Hospital Data
- 26,829 ER visits and hospitalizations from drug use (2010-2014)
- 7,200+ hospital inpatient admissions and ED encounters from prescription drugs alone (2011-2013)
For every overdose death, many more people require emergency medical care, creating substantial healthcare system burden beyond mortality.
Substance Use Prevalence
Youth (Ages 12-17)
Drug Use
- 8.53% or 7,000 teens used drugs in last month (17.49% more likely than average American teen)
- 71.43% of teen drug users reported marijuana use
- 12.39% used marijuana in last year
- 0.20% used cocaine in last year
- 0.18% used methamphetamine in last year
- 2.24% misused prescription pain relievers in last year
Substance Use Disorders
- 7.18% met criteria for Drug Use Disorder
- 3.49% met criteria for Alcohol Use Disorder
- 9.35% had any Substance Use Disorder
Historical Data (2017-2019)
- 13.3% past-month illicit drug use (higher than regional 8.3% and national 8.2%)
- 11.3% past-month marijuana use (higher than regional 6.8% and national 6.8%)
Montana youth show elevated rates of substance use compared to national peers, with marijuana being the dominant drug. The high rates of use disorders indicate many teens progress beyond experimentation to problematic use.
Young Adults (Ages 18-25)
Drug Use
- 41,000 used drugs in last month
- 33.46% more likely to use drugs than average American in age group
- 35.64% past-month illicit drug use
- 48.58% past-year marijuana use
- 35.80% past-month marijuana use
- 4.84% past-year cocaine use
- 10.61% past-year hallucinogen use
Substance Use Disorders
- 30.53% had Substance Use Disorder
- 23.85% had Drug Use Disorder
- 1.22% had Opioid Use Disorder
- 30.59% classified as needing treatment
Historical Data (2017-2019)
- 42.6% past-year marijuana use (increased from 2002-2004, higher than national 35.0%)
- 17.0% had Substance Use Disorder
- 8.2% had Illicit Drug Use Disorder
Young adults in Montana show alarming rates of substance use and disorder, with nearly one-third meeting criteria for substance use disorder. This age group faces the highest risk and represents a critical intervention target. It may be also problematic to detect marijuana use among this group due to the use of various THC detox methods.
Adults (All Ages 12+)
Drug Use (2022-2023)
- 23.39% (225,000) past-month illicit drug use
- 28.68% (276,000) past-year marijuana use
- 21.97% (211,000) past-month marijuana use
- 1.92% (18,000) past-year cocaine use
- 1.37% (13,000) past-year methamphetamine use
- 3.02% (29,000) past-year prescription pain reliever misuse
- 2.96% (28,000) past-year opioid misuse
Substance Use Disorders
- 20.23% (195,000) had Substance Use Disorder
- 11.50% (110,000) had Drug Use Disorder
- 1.73% (17,000) had Opioid Use Disorder
Historical Data
- 10.77% past-month illicit drug use (2009-2010, vs. national 8.82%)
- 10% used illicit drugs within past month (2005-2006)
- 20.1% past-year marijuana use (2017-2019, higher than national 16.2%)
- 11.3% non-medical drug use in past year (ranked 5th nationally)
Montana consistently ranks among states with highest substance use rates. Nearly one in four residents used illicit drugs recently, and one in five has a substance use disorder, indicating widespread substance abuse issues across the adult population. Members of this group also actively use detox shampoos to cheat hair drug tests.
Prescription Drug Abuse Trends (2007-2013)
Age Distribution – Primary Drug
| Age Group | 2007 | 2013 |
| Adolescent (0-17) | 0% | 1% |
| Young Adult (18-20) | 5% | 4% |
| Adult (21-64) | 95% | 93% |
| Senior (65+) | 0% | 1% |
Prescription drug abuse as primary drug remains concentrated among working-age adults, with minimal change over time.
Gender Distribution – Primary Drug
| Gender | 2007 | 2013 |
| Female | 63% | 44% |
| Male | 37% | 56% |
Significant shift toward male predominance in prescription drug abuse from 2007-2013, reversing earlier patterns where females were majority of users.
Race/Ethnicity – Primary Drug (2013)
| Race/Ethnicity | Percentage |
| White | 78% |
| American Indian | 17% |
| Multi-Racial | 4% |
| Other | 1% |
While White residents represent the majority of prescription drug abuse cases, American Indians are overrepresented relative to their population proportion.
Public Health Risk Perceptions
Marijuana Risk Perception (Ages 12+, 2022-2023)
- 14.57% perceive great risk from monthly marijuana use
- Youth (12-17): 17.47% perceive great risk
- Young adults (18-25): 7.88% perceive great risk
Low risk perception, especially among young adults, may contribute to high use rates. Youth show slightly more caution than young adults.
Cocaine Risk Perception
- 60.82% perceive great risk from monthly cocaine use
- Youth (12-17): 46.05% perceive great risk
- Young adults (18-25): 49.99% perceive great risk
Higher risk perception for cocaine than marijuana aligns with public health messaging, though nearly half of youth and young adults don’t perceive monthly cocaine use as highly risky.
Heroin Risk Perception
- 80.40% perceive great risk from trying heroin once or twice
- Youth (12-17): 53.59% perceive great risk
- Young adults (18-25): 74.74% perceive great risk
High overall risk perception for heroin hasn’t prevented the 475% increase in heroin use since 2013, suggesting risk perception alone is insufficient to deter use.
Treatment Statistics
Treatment Capacity and Utilization
- 93 active treatment facilities
- 4,537 clients serviced annually for drug rehab
- 4,260 clients in outpatient services annually
- 249 clients in residential (non-hospital) services
- 28 clients in hospital-based drug rehab
- 1 facility offers free drug rehab treatment
Historical Data
- 7,744 people enrolled in treatment (2010): 68.5% male, 31.5% female
- 5,064 people enrolled (single-day count, 2015)
- 4,537 people enrolled (single-day count, March 2019)
Treatment capacity has decreased over time despite growing need. The small number of residential and hospital-based treatment slots relative to need suggests significant access gaps.
Treatment by Problem Type (2019)
- 38.7% received treatment for drug problem only
- 22.4% received treatment for alcohol problem only
- 38.8% received treatment for both drug and alcohol problems
The high proportion receiving treatment for multiple substance problems reflects polysubstance use patterns seen in overdose data.
Treatment Costs
| Service Type | Average Cost per Person | Public Spending | Number Served |
| Outpatient | $1,627 | $6.93 million (0.3% of U.S. total) | 4,260 |
| Residential | $62,530 | $15.57 million (0.3% of U.S. total) | 249 |
| Average Total | $62,530 | N/A | N/A |
- Montana tied for 44th state (cheapest to most expensive) for residential treatment
- Approximately 10,067 adults seek substance abuse treatment annually
While Montana’s residential treatment costs are relatively low, the dramatic cost difference between outpatient ($1,627) and residential ($62,530) care creates financial barriers. With only 10,067 seeking treatment against 195,000 with disorders, most people needing help don’t receive it. That’s also the reasong why many local inhabitants engage in THC detox at home.
Medication-Assisted Treatment (MAT)
Methadone
- 727 people receiving methadone (March 2019)
- Increased from 489 people (2015)
Buprenorphine
- 625 people receiving buprenorphine (March 2019)
- Increased from 284 people (2015)
MAT utilization has grown substantially, with methadone up 49% and buprenorphine up 120%. However, with 17,000 people having opioid use disorder, only about 8% are receiving evidence-based medication treatment.
Treatment Gaps
- 5.78% received substance use treatment in past year
- 22.46% (216,000) classified as needing treatment
- 73.70% of those needing treatment did not receive it
Age-Specific Treatment Gaps
- Ages 12-17: 56.19% needing treatment didn’t receive it
- Ages 18-25: 84.21% needing treatment didn’t receive it
- Ages 26+: 72.53% needing treatment didn’t receive it
Historical Data
- Only 8% of alcohol-dependent people entered treatment
- Over 7% (65,000) had alcohol use disorder
The treatment gap is severe across all age groups, with young adults facing the largest gap. For every person receiving treatment, three others who need it go without. This represents a massive unmet need and missed opportunity for intervention.
Primary Drugs of Abuse in Treatment
Marijuana
- Most commonly cited drug among primary rehab admissions
- 29.5% of 12-17 year olds dependent on marijuana (2010)
- Highest rates of dependence among adolescents
Marijuana’s position as the most common treatment admission reason, especially among youth, contrasts with its absence from overdose deaths, suggesting different intervention needs for different substances.
Amphetamines/Methamphetamine
- 498 people entered treatment for amphetamine use (2010)
- Largest age group: 26-30 year olds at 23.7%
The age distribution for methamphetamine treatment admissions aligns with overdose death patterns, indicating consistent impact across the adult lifespan.
Prescription Opioids
- 841 people admitted for opiates other than heroin (2010)
- 54.1% female, 45.9% male
Unlike other substances, prescription opioid treatment admissions show near gender parity, possibly reflecting prescribing patterns or pain management practices.
Criminal Justice Impact
Drug Arrests and Violations
- Drug-related arrests increased 62% between 2009-2015
- Drug charges now account for 18% of all arrests
- Drug charges are leading categories for both misdemeanor and felony arrests
- 57% of drug violations involved marijuana (2015)
- 31% of drug violations involved methamphetamines (2015)
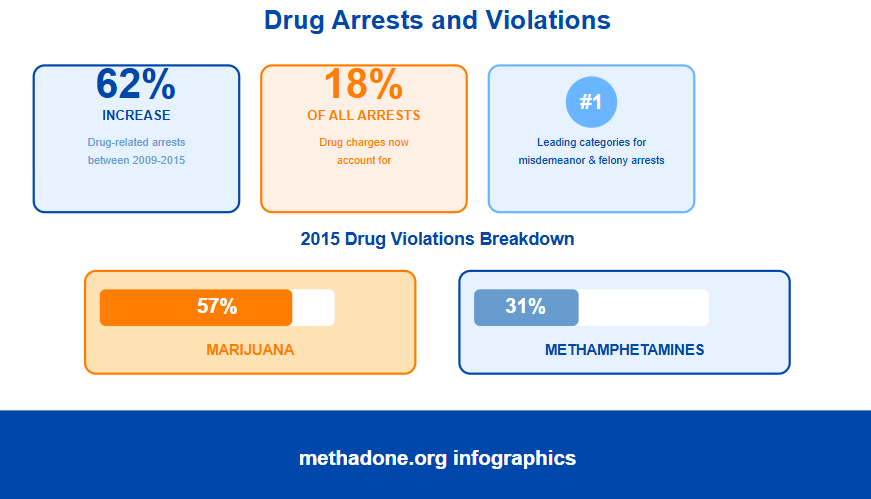
The dramatic increase in drug arrests reflects both increased use and law enforcement focus. The predominance of marijuana arrests contrasts with the greater harm from opioids and methamphetamine. Individuals on parole and probation also actively use various THC detox means to avoid incarceration.
Incarceration
- Jail population rate changed from 261 per 100k (2000) to 349 per 100k (2015)
- 34% increase in jail population
- Overdose death rate increased 171% over same period (4 to 12 per 100k, 2000-2018)
Despite substantial increases in incarceration, overdose deaths increased at five times the rate, suggesting enforcement alone is insufficient to address the crisis.
Montana faces a persistent and evolving substance abuse crisis characterized by rates of illicit drug use consistently above national averages and dramatic increases in overdose deaths driven primarily by fentanyl and methamphetamine. The most urgent concerns include the disproportionate impact on American Indian communities, who experience overdose death rates over three times the state average, and the severe treatment gap where three-quarters of individuals needing substance use services do not receive them. While enforcement efforts have intensified with drug arrests increasing 62%, the corresponding 171% rise in overdose deaths demonstrates that incarceration alone cannot solve this public health emergency. Comprehensive solutions must prioritize expanding access to evidence-based treatment, culturally-appropriate interventions for vulnerable populations, and harm reduction strategies to address Montana’s growing polysubstance use patterns.
Statistical Data on Alcohol in Montana
Montana faces significant challenges with alcohol-related issues, ranking among the states with the highest rates of excessive drinking and alcohol-related fatalities in the United States. The state’s alcohol consumption patterns are notably above national averages across multiple demographics, from youth to adults. This comprehensive report presents data on alcohol use patterns, mortality rates, substance use disorders, treatment needs, and economic impacts in Montana, drawing from multiple years of surveillance data (2002-2024).
Alcohol-Related Deaths
Overall Mortality Statistics
Total Annual Deaths and Demographics
- 605 annual deaths in Montana are attributable to excessive alcohol use
- 2.81% of deaths from excessive alcohol use are individuals under age 21
- Montana averages 1 death for every 1,792 people aged 18 and older
- 7.10 deaths per 10,000 adults
Montana’s alcohol-related death rate is exceptionally high, with the state experiencing one death from excessive alcohol use for every 1,792 adults. The relatively low percentage of underage deaths (2.81%) indicates that the primary burden falls on adult populations.
Death Demographics by Gender and Age
- 68.1% of excessive alcohol use deaths are male
- 84.0% of deaths are adults aged 35 years and older
- 62.1% of deaths are from chronic causes (such as Alcohol Use Disorder)
The gender disparity is pronounced, with men accounting for more than two-thirds of alcohol-related deaths. The concentration of deaths in older adults (35+) and the high proportion from chronic causes suggests long-term patterns of excessive drinking rather than acute incidents.
Mortality Trends Over Time
Decade-Long Comparison
- 2009-2013: 1,563 alcohol-related deaths (5-year total)
- 2019-2023: 2,941 alcohol-related deaths (5-year total)
- This represents nearly double the number of deaths
Rate Increases
- The 5-year average annual rate of excessive alcohol deaths per capita increased by as much as 42.0% from 2015 to 2019
- 15,254 years of potential life are lost to excessive alcohol use each year (CDC estimate)
The dramatic increase in alcohol-related deaths over the past decade—nearly doubling from 1,563 to 2,941—signals a worsening crisis. The 42% increase in per capita death rates from 2015 to 2019 alone demonstrates accelerating mortality trends that demand urgent public health intervention.
Comparative Death Rates
Per Capita Mortality (per 100,000 people)
| Category | United States | Montana |
| Alcohol-induced death rate (adults 25+) | 17.3 (2019) | 30.9 (2019) |
| Death rate from alcohol-involved car crashes | 2.3 (2018) | 6.8 (2018) |
Historical Context
- From 2006-2010: 390 Montana residents died from alcohol consumption
- Rate: 37.7 deaths per 100,000—the highest rate in the country
Montana’s alcohol-induced death rate of 30.9 per 100,000 is nearly double the national average of 17.3. The state’s alcohol-related traffic fatality rate of 6.8 per 100,000 is triple the national rate, highlighting both the prevalence of drinking and the dangerous combination with driving.
Alcohol Use Patterns
Adult Alcohol Consumption (2022-2023)
Past Month Alcohol Use
| Age Group | Number (thousands) | Percentage |
| 12+ | 498 | 51.75% |
| 12-17 | 7 | 7.86% |
| 18-25 | 64 | 55.96% |
| 26+ | 427 | 55.93% |
| 18+ | 491 | 55.94% |
More than half of Montana adults (55.94%) reported alcohol use in the past month, with particularly high rates among young adults aged 18-25 (55.96%). The relatively low rate among 12-17 year-olds (7.86%) suggests prevention efforts may be having some impact on the youngest demographic.
Underage Drinking (Ages 12-20)
- 21,000 individuals aged 12-20 used alcohol in the past month
- 17.40% prevalence rate
- 13,000 individuals engaged in binge drinking
- 10.52% binge drinking prevalence
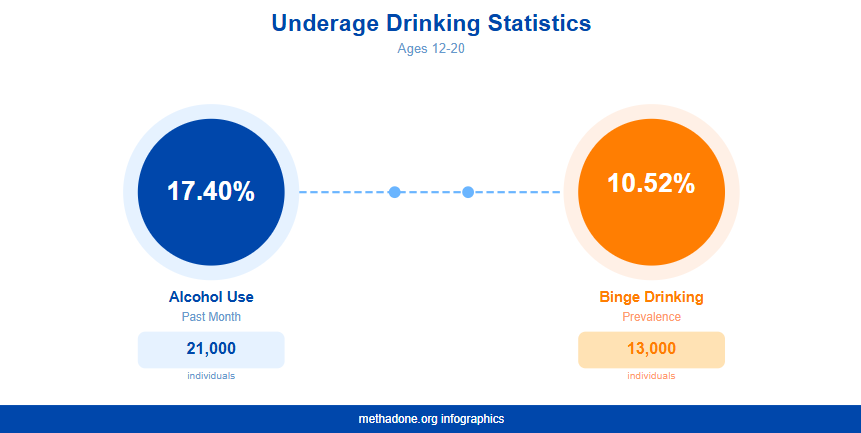
Nearly one in five Montana minors (17.40%) reported recent alcohol use, with more than half of those (10.52% overall) engaging in binge drinking. This indicates that underage drinkers are more likely to consume alcohol in dangerous patterns.
Comparison to National Data
| Indicator | United States | Montana |
| Adults 18+ drinking in past month | 52.8% | 59.1% |
| Adults 18+ binge drinking in past month | 15.2% | 19.5% |
Montana adults drink at notably higher rates than the national average, with a 6.3 percentage point difference in overall consumption and a 4.3 percentage point difference in binge drinking.
Youth Alcohol Use
High School Students
| Indicator | United States | Montana |
| Alcohol use in past 30 days | 22.1% | 26.2% |
| Binge drinking in past 30 days | 8.8% | 13.4% |
| Binge drinking (2019) | 14% | 18% |
Montana high school students drink at rates 4.1 percentage points higher than the national average, with binge drinking rates 4.6-4.9 percentage points higher. The 18% binge drinking rate (2019 data) means nearly one in five Montana high schoolers engage in this high-risk behavior.
Additional Youth Statistics
- One in three high school students reported alcohol use in the last month
- Over 50% of students who reported alcohol use also engaged in binge drinking
- 61% of high school teenagers report having engaged in binge drinking (lifetime)
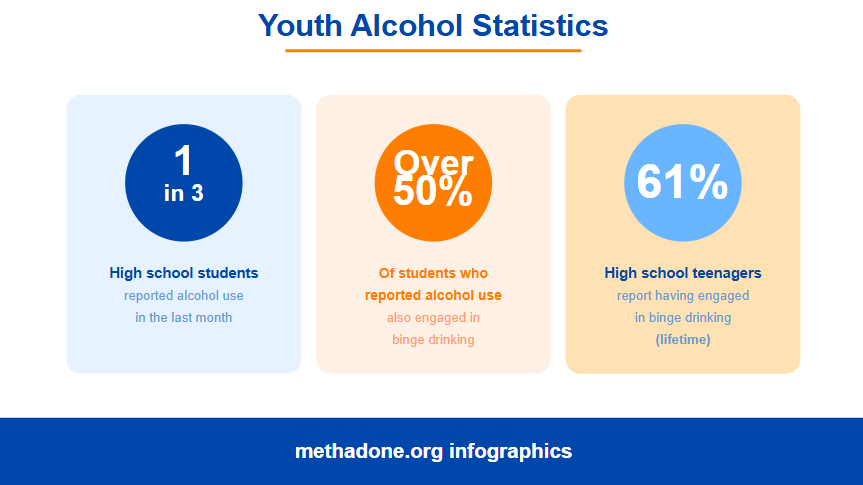
The statistic that 61% of Montana high school teenagers have ever engaged in binge drinking is particularly concerning, indicating widespread exposure to dangerous drinking patterns during adolescent development. The fact that over half of student drinkers binge drink suggests normalization of excessive consumption.
Ages 12-17 (2022-2023)
- 7,000 youth used alcohol in the past month
- 7.86% prevalence rate
Past Month Alcohol Use Changes (Ages 12-17)
- 2002-2004: Higher rates
- 2017-2019: 13.5% or 10,000 youth
- Montana rate higher than regional average (8.5%) and national average (9.4%)
While youth drinking has decreased from 2002-2004 to 2017-2019, Montana youth still drink at significantly higher rates than their regional and national peers. The 13.5% rate is 5 percentage points above the regional average and 4.1 points above the national average.
Youth Rank
- Montana Value: 9.4% (children ages 12-17 drinking in past month)
- Montana Rank: 48th
Montana’s 48th ranking indicates the state has the 3rd highest rate of youth drinking in the nation, representing a critical public health concern for underage populations.
Young Adult Patterns (Ages 18-25)
Binge Drinking Trends (2017-2019)
- Montana: 45.7% or 50,000 young adults
- Regional average: 36.3%
- National average: 35.4%
- No significant change between 2015-2017 and 2017-2019
Nearly half of Montana young adults (45.7%) engage in binge drinking—10.3 percentage points above the national average. The lack of improvement between 2015-2017 and 2017-2019 suggests stagnation in addressing this age group’s drinking patterns.
Binge Drinking Patterns
Past Month Binge Alcohol Use (2022-2023)
| Age Group | Number (thousands) | Percentage |
| 12+ | 221 | 22.94% |
| 12-17 | 3 | 3.96% |
| 18-25 | 40 | 34.67% |
| 26+ | 177 | 23.24% |
| 18+ | 217 | 24.75% |
Nearly one-quarter of Montana adults (24.75%) engage in binge drinking monthly. Young adults aged 18-25 show alarming rates at 34.67%—more than one in three. This age group’s elevated binge drinking correlates with their higher rates of alcohol use disorder.
Specific Adult Binge Drinking Statistics
- 19.7% of Montana adults over 18 binge drink at least once per month
- Median number of drinks per binge: 5.4 drinks
- Top 25% most active drinkers consume: 7.3 drinks per binge
- Median binge frequency: 1.6 times monthly
- Top 25% most active drinkers binge: 4.0 times per month
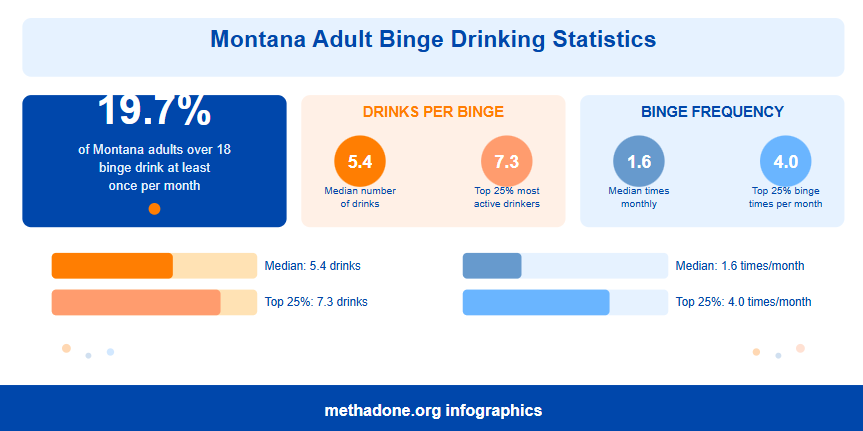
The distinction between typical and heavy binge drinkers is significant—the most active quarter of binge drinkers consume 34% more per session (7.3 vs 5.4 drinks) and binge 2.5 times more frequently (4.0 vs 1.6 times monthly), representing a high-risk subpopulation.
Excessive Drinking Rate
- Montana: 21.0% (2019 data)
- Montana Rank: 45th (indicating high rates relative to other states)
- Alternative measurement: 24.3% excessive drinking rate
Montana’s ranking of 45th indicates the state is among the worst five states for excessive drinking. The excessive drinking definition includes both binge drinking and heavy drinking patterns, affecting approximately one in four Montana adults.
Risk Perception
Perceptions of Great Risk from Having 5+ Drinks Once or Twice Weekly (2022-2023):
| Age Group | Number (thousands) | Percentage |
| 12+ | 371 | 38.59% |
| 12-17 | 30 | 36.27% |
| 18-25 | 39 | 33.76% |
| 26+ | 302 | 39.58% |
| 18+ | 341 | 38.81% |
| Ages 12-20 | 43 | 34.84% |
Only about one-third of young adults (33.76%) and underage drinkers (34.84%) perceive great risk from regular heavy drinking, compared to nearly 40% of older adults. This lower risk perception among the groups with highest binge drinking rates may contribute to their problematic consumption patterns.
Alcohol Use Disorder
Prevalence (Past Year Alcohol Use Disorder 2022-2023)
| Age Group | Number (thousands) | Percentage |
| 12+ | 105 | 10.97% |
| 12-17 | 3 | 3.49% |
| 18-25 | 22 | 18.75% |
| 26+ | 81 | 10.61% |
| 18+ | 103 | 11.68% |
| Ages 12-20 | 9 | 7.22% |
More than one in ten Montana residents aged 12+ (10.97%) meet criteria for alcohol use disorder. The rate nearly doubles for young adults aged 18-25 (18.75%), affecting nearly one in five individuals in this age group. This concentration in young adulthood represents a critical intervention opportunity.
Historical Trends
Young Adults (Ages 18-25)
- 2002-2004: Higher rates (specific percentage not provided)
- 2017-2019: 12.5% or 14,000 individuals
- Decreased between the two periods
- Montana rate similar to regional average (11.7%) and national average (9.8%)
While young adult alcohol use disorder has decreased since 2002-2004, the 2017-2019 rate of 12.5% remained above the national average. The more recent 2022-2023 data showing 18.75% suggests a concerning reversal of this positive trend.
Overall Population (Ages 12+)
- 2002-2004: Higher rates (specific percentage not provided)
- 2017-2019: 7.9% or 70,000 individuals
- Decreased between the two periods
- Montana rate similar to regional average (6.9%) but higher than national average (5.3%)
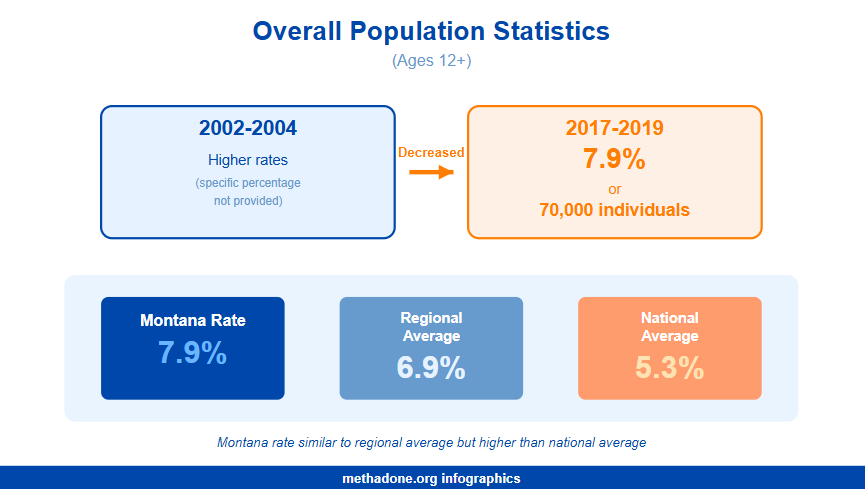
Despite decreases from 2002-2004 to 2017-2019, Montana’s alcohol use disorder rate remained 2.6 percentage points above the national average. The more recent data (10.97% in 2022-2023) indicates a substantial increase, suggesting worsening conditions.
Treatment and Service Needs
Treatment Receipt (Past Year Substance Use Treatment 2022-2023)
| Age Group | Number (thousands) | Percentage |
| 12+ | 56 | 5.78% |
| 12-17 | 5 | 5.80% |
| 18-25 | 5 | 4.74% |
| 26+ | 45 | 5.94% |
| 18+ | 51 | 5.78% |
Treatment receipt rates are remarkably consistent across age groups (4.74%-5.94%), suggesting similar barriers to care regardless of age. However, these rates appear insufficient given the prevalence of disorder and need for treatment.
Treatment Need
Classified as Needing Substance Use Treatment
| Age Group | Number (thousands) | Percentage |
| 12+ | 216 | 22.46% |
| 12-17 | 11 | 12.79% |
| 18-25 | 35 | 30.59% |
| 26+ | 170 | 22.28% |
| 18+ | 205 | 23.38% |
Nearly one-quarter of Montana residents (22.46%) are classified as needing substance use treatment, with young adults aged 18-25 having the highest need at 30.59%—nearly one in three. This represents a massive treatment gap.
Not Receiving Treatment Among Those Needing It
| Age Group | Number (thousands) | Percentage Not Receiving Treatment |
| 12+ | 156 | 73.70% |
| 12-17 | 6 | 56.19% |
| 18-25 | 31 | 84.21% |
| 26+ | 119 | 72.53% |
| 18+ | 150 | 74.66% |
The treatment gap is alarming—nearly three-quarters (73.70%) of those needing treatment do not receive it. Young adults aged 18-25 face the worst treatment gap at 84.21%, meaning more than four out of five who need treatment go without it. Youth aged 12-17 have the best (though still poor) treatment access at 56.19% not receiving needed care.
Treatment Entry Statistics (2010)
Alcohol-Specific Treatment
- 2,003 people entered rehab for alcohol only
- 2,699 people entered treatment for alcohol combined with a secondary drug
- Total: 4,702 individuals receiving treatment for alcohol abuse
Treatment Facilities (2024)
- Among Montanans receiving treatment for substance use disorders: 66.7% reported alcohol as primary substance
- Additional 8.4% reported alcohol as secondary substance
- Combined: 75.1% of treatment recipients report alcohol misuse
Alcohol remains the dominant substance of concern in Montana’s treatment system, with three-quarters of treatment recipients reporting alcohol issues. The 2010 data of 4,702 treatment entries represents a significant population requiring intensive services.
Healthcare Utilization and Costs
Hospital and Emergency Services
2023 Statistics
- 16,914 alcohol-related hospitalizations and emergency department visits
- $222 million charged by Montana hospitals
- Average cost per incident: $13,125
The $222 million in annual hospital charges represents a substantial healthcare burden, averaging over $13,000 per alcohol-related visit. The 16,914 visits translate to more than 46 alcohol-related hospital or ED visits every day in Montana.
2019 Statistics
- 18,157 alcohol-related hospitalizations and emergency department visits
- $189 million charged by Montana hospitals
Comparing 2019 to 2023, there was a 6.8% decrease in visit volume (18,157 to 16,914) but a 17.5% increase in costs ($189M to $222M), suggesting either increased severity of cases or healthcare cost inflation.
Historical Context (2010-2014)
- 41,595 emergency room visits and hospitalizations for alcohol use over 5 years
- Average: 8,319 per year
The doubling from an average of 8,319 annual visits (2010-2014) to 16,914 visits (2023) demonstrates a dramatic escalation in acute alcohol-related healthcare needs over the past decade.
Emergency Medical Services (2019)
79% of all substance use-related EMS activations involved alcohol
The dominance of alcohol in emergency medical responses underscores its role as the primary substance crisis in Montana, far exceeding all other substances combined.
Economic Impact
Taxpayer Costs (2010, inflation-adjusted)
- Original cost: $870.8 million
- 2022 equivalent: $1.176 billion
- Cost per drink: $2.34 (2022 dollars)
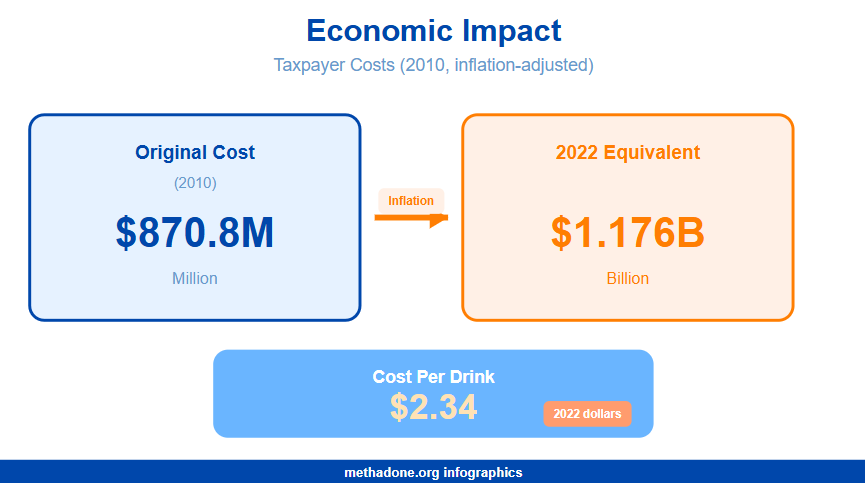
Montana taxpayers bear more than $1 billion annually in costs from excessive alcohol use, equivalent to $2.34 for every alcoholic drink consumed in the state. This includes healthcare, law enforcement, lost productivity, and other societal costs.
Traffic Safety and Impaired Driving
DUI Arrests and Fatalities
DUI Arrests (2023)
- 3,997 DUI arrests in Montana
- 13.6% of all arrests made by law enforcement were alcohol-related DUIs
More than one in eight arrests in Montana are for DUI, indicating the substantial law enforcement resources devoted to addressing impaired driving and the prevalence of this dangerous behavior.
Fatal Crashes Involving Alcohol
| Indicator | United States | Montana |
| Fatal crashes involving impaired driver (BAC 0.08+) | 31.8% | 33.3% |
| Alcohol-related traffic fatalities (2018) | — | 37% |
| Driving fatalities involving alcohol | — | 46% |
Montana consistently exceeds national averages for alcohol involvement in fatal crashes. The statistic that 46% of driving fatalities involve alcohol—nearly half of all traffic deaths—represents a severe public safety crisis. Montana has the highest percentage of alcohol-involved driving fatalities in the nation.
Self-Reported Impaired Driving
Adults
- 2017-2018: 14% of Montana adults reported driving under the influence in the past year
- National average (same period): 9%
Montana adults drive under the influence at rates 55% higher than the national average, indicating both high rates of impairment and concerning attitudes toward impaired driving.
Students
| Group | Behavior | Percentage |
| College students | Drove under influence in past 3 months | >20% |
| High school students | Drove under influence in past 30 days | ~6% |
| High school students | Rode with impaired driver in past 30 days | 16.8% |
More than one-fifth of college students reported recent impaired driving, representing a particularly dangerous behavior among young adults. The 16.8% of high school students who rode with impaired drivers indicates widespread exposure to risk, even among those not driving themselves.
Alcohol Sales Data
Spirits Sales (2024)
Volume Sales by Category (9-liter cases in thousands)
| Category | Volume Sales |
| Vodka | 312 |
| Straight Whiskey | 138 |
| Cordials/Liqueurs | 139 |
| Canadian Whisky | 171 |
| Rum | 79 |
| Tequila | 78 |
| Cocktails | 76 |
| Gin | 39 |
| Irish Whiskey | 25 |
| Scotch Whisky | 13 |
Total Spirits: 1,070 thousand 9-liter cases
Vodka dominates Montana’s spirits market with 312,000 cases (29.2% of total spirits sales), followed by whiskey categories. The combined whiskey sales (straight, Canadian, Irish, and Scotch) total 347,000 cases, representing 32.4% of the spirits market.
Beer Sales (2023)
Volume Sales by Category (9-liter cases in millions)
| Category | Volume Sales |
| Light | 4.4 |
| Craft | 2.7 |
| Super & Super Premium | 1.6 |
| FMBs & Hard Seltzer | 1.4 |
| Imported | 1.3 |
| Popular | 0.8 |
Total Beer: 12.2 million 9-liter cases
Light beer dominates Montana’s beer market at 4.4 million cases (36.1% of beer sales). Craft beer holds strong second place at 2.7 million cases (22.1%). The 1.4 million cases of flavored malt beverages and hard seltzers represent growing alternative alcoholic beverage preferences.
Wine Sales (2023)
Volume Sales by Category (9-liter cases in thousands)
| Category | Volume Sales |
| Table Wine | 887 |
| Champagne & Sparkling | 55 |
| Dessert & Fortified | 8 |
| Wine Based RTD | 3 |
| Vermouth & Aperitif | 3 |
Total Wine: 956 thousand 9-liter cases
Table wine comprises the vast majority of wine sales at 887,000 cases (92.8% of wine sales). Champagne and sparkling wines are distant second at 55,000 cases. The wine market is substantially smaller than beer (956,000 vs 12.2 million cases).
Overall Alcohol Sales Summary
- Beer: 12,200,000 cases (85.6%)
- Spirits: 1,070,000 cases (7.5%)
- Wine: 956,000 cases (6.7%)
Total: 14,226,000 9-liter cases
Beer dominates Montana’s alcohol market, accounting for more than 85% of total volume sales. The high volume of alcohol sales corresponds with Montana’s elevated consumption and problem drinking rates documented throughout this report.
Montana faces a severe and worsening alcohol crisis characterized by exceptionally high rates of consumption, binge drinking, disorder, mortality, and impaired driving compared to national averages. The data reveals persistent patterns across age groups, with particularly concerning rates among young adults and high school students, substantial treatment gaps, and mounting economic and healthcare costs. Addressing Montana’s alcohol crisis requires comprehensive interventions spanning prevention, treatment access, enforcement, and policy measures.
Conclusion
In general, Montana confronts a critical dual substance crisis characterized by escalating drug overdose deaths—increasing 37.59% over three years, driven primarily by fentanyl and methamphetamine—and alcohol-related mortality that has nearly doubled in the past decade, with 605 annual deaths from excessive drinking. The state consistently ranks among the nation’s highest for substance use prevalence across all age groups, yet faces severe treatment gaps where three-quarters of individuals needing care do not receive it. American Indian populations experience particularly devastating disparities, with overdose death rates more than triple the state average, while young adults aged 18-25 show alarming rates of both substance use disorders (30.53%) and binge drinking (45.7%). Despite increased law enforcement efforts, the crisis continues to worsen, demanding comprehensive public health interventions that prioritize expanded treatment access, culturally-appropriate services for vulnerable populations, and evidence-based harm reduction strategies.
Sources:
- Drug Abuse Statistics
- MONTANA – National Survey on Drug Use and Health
- Explore Non-Medical Drug Use – Past Year in Montana | AHR
- Montana – Overdose Deaths and Jail Incarceration
- Montana Substance Abuse Treatment Statistics
- Drug and Alcohol Statistics in Montana | Health Care Montana Addiction Treatment
- Opioid Use/Misuse in Older Adults – Extension Family & Human Development | Montana State University
- Drug Overdose Deaths in Montana 2014-2023
- The Drug Impact on Montana
- MONTANA DRUG CONTROL UPDATE Drug Use Trends in Montana Substance Abuse Treatment Admissions Data
- Montana Drug Statistics | Recovery Connection
- Behavioral Health Barometer: Montana, Volume 6
- Montana Drug and Alcohol Addiction Information
- Alcohol Use in Montana
- Explore Excessive Drinking in Montana | AHR
- Explore Alcohol Use – Youth in Montana | AHR
- Top 10 states for excessive drinking
- Montana Alcohol Laws and Sales (Buying & Selling in 2025)