Statistical Data on Drugs in Hawaii
Hawaii faces a persistent and escalating substance abuse emergency with overdose deaths reaching 22 per 100,000 residents in 2023—a 95% surge since 2013—as methamphetamine dominates the crisis, accounting for 62% of all overdose fatalities. The Pacific state’s unique challenges include the nation’s most severe treatment gap with only 18,000 people accessing care annually while 91,000 require intervention, compounded by methamphetamine addiction rates among the unhoused population reaching 74% and fentanyl deaths increasing 6-fold since 2019. Despite maintaining overdose rates 32% below the national average and operating 177 treatment facilities, Hawaii continues confronting geographic disparities where rural counties experience overdose rates 65% higher than urban areas, while Native Hawaiian communities face disproportionate substance abuse burdens in a state where illicit drug use has consistently exceeded national averages by 25% since 2007.
Overall Drug Overdose Statistics
Statewide Overdose Deaths (2023)
- Total overdose deaths: 320 deaths (22 per 100,000 residents)
- Previous reporting (2020): 242 deaths (15.9 per 100,000 residents)
- National comparison: 23.19% below national average death rate (2020), 32% lower than US rate (2023)
- Trend analysis: 2.93% annual increase over last 3 years, 95% increase since 2013, 50% increase since 2018
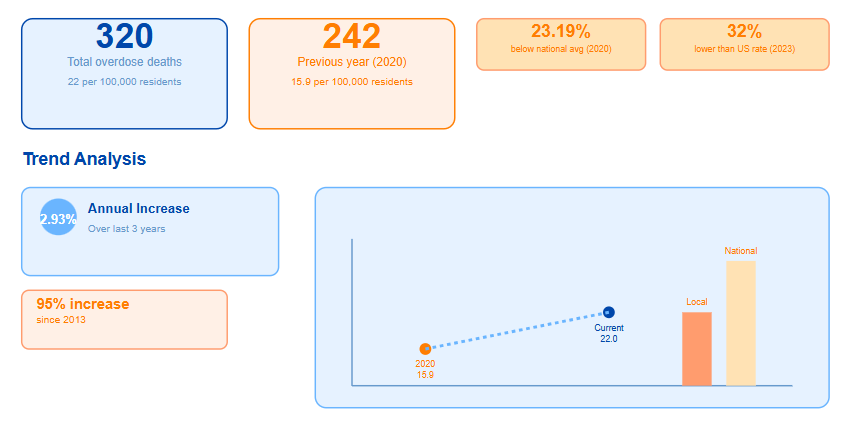
Hawaii has experienced a dramatic escalation in overdose deaths, nearly doubling since 2013 despite remaining below national averages. The acceleration in recent years indicates an intensifying crisis requiring immediate attention.
County-Level Overdose Death Rates (2023)
| County | Deaths per 100,000 |
| Maui County | 33.5 |
| Kauai County | 32.5 |
| Honolulu County | 20.2 |
| Hawaii County | 19.7 |
Significant geographic disparities exist, with rural counties (Maui and Kauai) experiencing overdose rates 65-70% higher than the more populated counties, suggesting rural areas face greater substance abuse challenges.
Historical Overdose Trends (2016-2020)
| Year | Total Deaths | Death Rate |
| 2016 | 249 | 2.5% of all deaths |
| 2017 | 225 | 1.9% of all deaths |
| 2018 | 226 | 2.2% of all deaths |
| 2019 | 265 | 2.3% of all deaths |
| 2020 | 266 | 2.2% of all deaths |
After a dip in 2017-2018, overdose deaths surged in 2019 and remained elevated, indicating a stabilization at higher levels before the dramatic increase to 320 deaths by 2023.
Methamphetamine Crisis
Methamphetamine Dominance
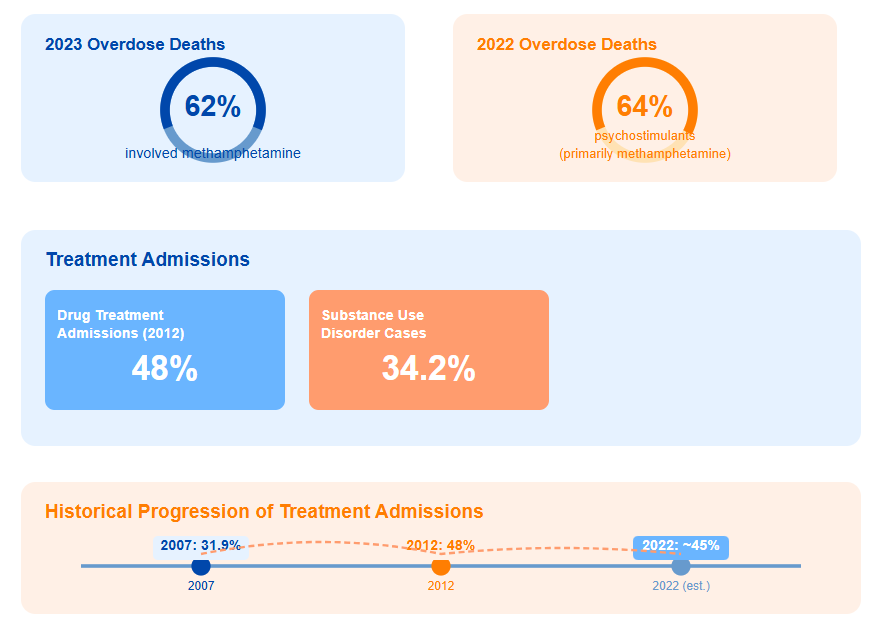
- 2023: 62% of total overdose deaths involved methamphetamine
- 2022: 64% of overdose deaths involved psychostimulants (primarily methamphetamine)
- Treatment admissions: 48% of drug treatment admissions (2012), 34.2% of substance use disorder cases
- Historical progression: 31.9% of treatment admissions (2007) → 48% (2012) → ~45% (2022 estimate)
Methamphetamine-Specific Statistics
- Workplace drug positivity: Notably higher than national benchmarks
- Geographic concentration: 86% lifetime use among Hawaii County’s unhoused population
- Price volatility during COVID-19: $350/ounce (early 2020) → $2,100/ounce (mid-2020) → $650/ounce (end 2020)
- Polysubstance use: 28% combined with marijuana, 38.6% combined with alcohol
- Prison population: Nearly 35% of men imprisoned in Honolulu had ingested meth
Methamphetamine has emerged as Hawaii’s most severe drug crisis, showing consistent growth in treatment admissions and overdose involvement over two decades. The COVID-19 price fluctuations demonstrate how external factors can dramatically impact drug markets.
Opioid Crisis
Opioid Overdose Statistics (2023)
Total opioid deaths: 133 (9.4 per 100,000 residents)
- National comparison: 60.8% lower than national opioid death rate
- Percentage of all overdoses: 41.6% involve opioids
- Fentanyl involvement: 85% of all opioid overdose deaths involve synthetic opioids (primarily fentanyl)
- Heroin involvement: 10.5% of opioid overdose deaths
- Prescription opioids: 15% of opioid overdose deaths
Opioid Trends and Prescription Data
- Trend increase: 54% increase in opioid-related fatalities from 2018 (4.1 per 100k) to 2021 (6.3 per 100k)
- Fentanyl growth: Deaths increased 6.2 times between 2019-2023
- Prescription rate: Doctors write prescriptions for 22.6% of residents (33.4 per 100 persons in 2018)
- National comparison: Below US average of 51.4 prescriptions per 100 persons
- Neonatal impact: 3.2 per 1,000 births diagnosed with neonatal Opioid Withdrawal syndrome (2020)
While Hawaii’s opioid death rates remain below national averages (based on hair drug testing results and the use other drug detection tools), the rapid growth in fentanyl-related deaths and the dominance of synthetic opioids indicate an evolving and dangerous opioid landscape.
Marijuana Usage Patterns
Marijuana Usage Statistics
- Past-year users: 175,000 people (15.23% of population 12+)
- Past-month users: 135,000 people (11.72% of population 12+)
- Treatment admissions: 38% (2012), stabilized at 21.8% (2022)
- Youth statistics: 133,000 past-year users, 13.73% of 12-17 year olds
Marijuana Perceptions
- Risk perception decline: 273,000 individuals view monthly use as high-risk (2020)
- Age group differences: 12.95% of 18-25 year olds vs 25.21% of 26+ view monthly use as great risk
- Treatment vs alcohol: Marijuana treatment admissions (21.8%) outpaced alcohol-only cases (14.2%) in 2022
Youth Marijuana Usage Trends
| Survey Year | Lifetime Use (High School) | Use Before Age 13 |
| 2015 | ~46% | 13.8% |
| 2017 | ~48% | 14.2% |
| 2020 | ~44% | 13.5% |
Marijuana remains the most widely used illicit substance with relatively stable patterns. However, early initiation rates among youth and declining risk perceptions suggest potential for increased future problems. One of the major contributing factors is the belief that it’s possible to detox from weed at home quickly and with minimal risk.
Trends and Projections
Historical Patterns (2007-2023)
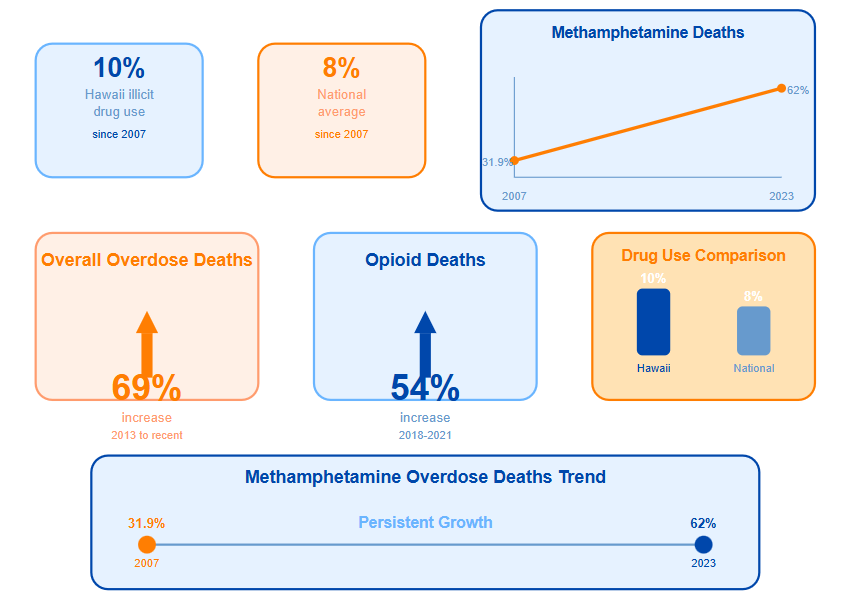
- Illicit drug use: Consistently 10% in Hawaii vs 8% national average since 2007
- Methamphetamine: Persistent growth from 31.9% (2007) to 62% of overdose deaths (2023)
- Overall overdose deaths: 69% increase from 2013 to most recent reporting
- Opioid deaths: 54% increase from 2018-2021
Recent Concerning Trends
- Emergency department visits: 77.5% increase in drug-related visits (2021-2022)
- Meth hospitalizations: 39% increase in overdose hospitalizations (2021-2022)
- Counterfeit pills: Increasing trafficking of fentanyl-laced oxycodone
- Polysubstance use: Growing complexity in substance use patterns
Hawaii’s substance abuse landscape shows persistent and worsening trends across multiple indicators. The combination of increasing overdose deaths, rising emergency department visits, and limited treatment capacity suggests the crisis will continue to intensify without significant intervention.
Youth and Adolescent Substance Use
Overall Youth Statistics (Ages 12-17)
- Illicit drug use: 7,000 youth (7.26% of 12-17 year olds) used drugs in past month
- Alcohol use: 6.54% used alcohol in past month (4.87% less likely than national average)
- Drug use comparison: Equal to national average for teen drug use
- Substance use disorders: 5.20% met criteria for drug use disorder, 3.29% for alcohol use disorder
Specific Youth Drug Usage
- Marijuana dominance: 71.43% of youth drug users reported marijuana use
- Annual marijuana use: 9.70% of 12-17 year olds
- Cocaine use: 0.20% annual use
- Methamphetamine: 0.13% annual use
- Pain relievers: 1.60% annual misuse
High School Polysubstance Use (2025 Data)
- Triple use: 5% (1 in 20) used alcohol, nicotine, and cannabis in past 30 days
- Dual use: 9.5% used both nicotine and cannabis in past 30 days
- Treatment admissions: 67.2% of youth treatment admissions involved marijuana
Youth substance use patterns show marijuana as the primary concern, with concerning polysubstance use patterns emerging. The relatively low rates of hard drug use among youth is encouraging, though early marijuana initiation remains problematic.
Adult Substance Use Patterns
Young Adults (Ages 18-25)
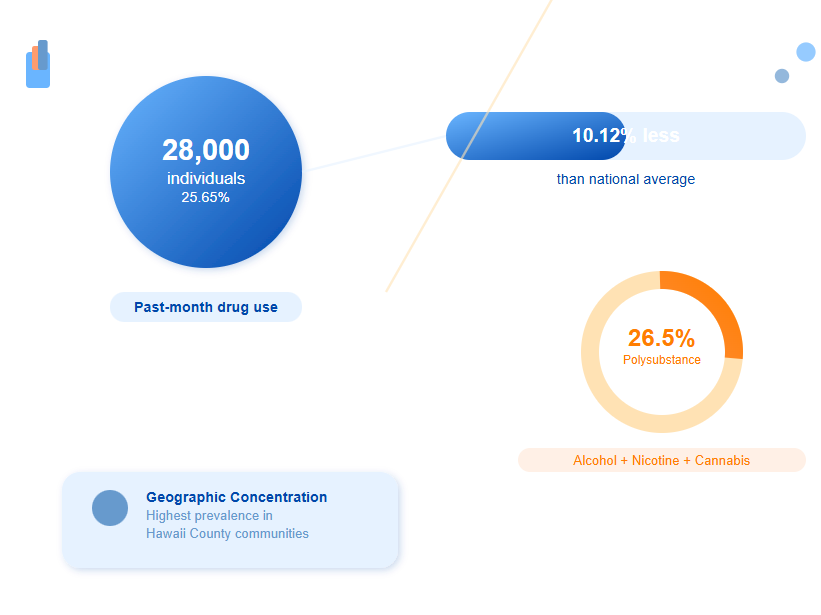
- Past-month drug use: 28,000 individuals (25.65% of age group)
- National comparison: 10.12% less likely to use drugs than national average
- Polysubstance use: 26.5% used combination of alcohol, nicotine, and cannabis
- Geographic concentration: Highest prevalence in Hawaii County communities
Adult Usage by Substance (2019-2020 Average)
| Substance | Past Month Users | Percentage of 12+ Population |
| Marijuana | 135,000 | 11.72% |
| Illicit drugs other than marijuana | 34,000 | 2.93% |
| Past year cocaine | 21,000 | 1.83% |
| Past year methamphetamine | 10,000 | 0.83% |
| Prescription pain reliever misuse | 32,000 | 2.79% |
Adult substance use shows marijuana as the dominant illicit substance, with concerning levels of polysubstance use particularly among young adults. Many individuals also try to cheat drug testing, including hair tests, for job-related reasons. The geographic concentration in Hawaii County suggests regional factors influencing use patterns.
Treatment Statistics and Capacity
Treatment Demand vs. Capacity
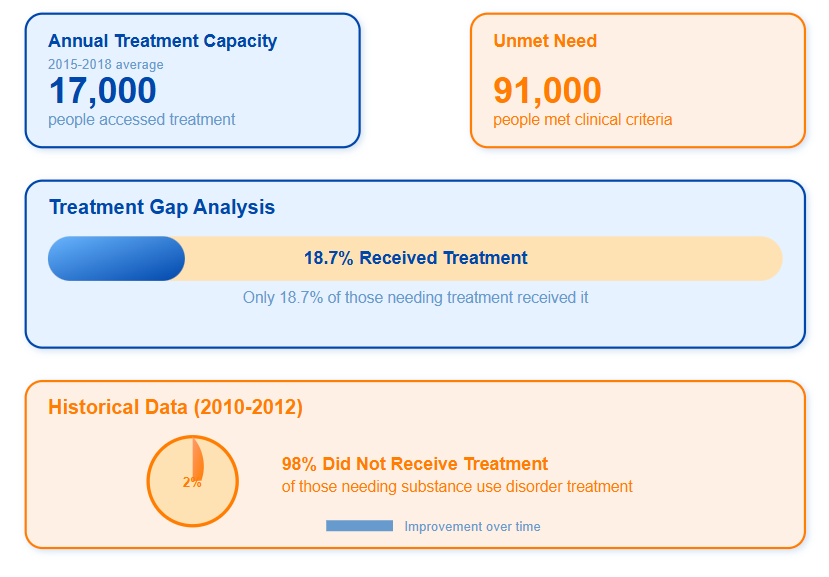
- Annual treatment capacity: 17,000 people accessed treatment (2015-2018 average)
- Unmet need: 91,000 people met clinical criteria for treatment
- Treatment gap: Only 18.7% of those needing treatment received it
- Historical data: 98% of those needing substance use disorder treatment did not receive it (2010-2012)
Treatment Facility Distribution
- Total facilities: 177 substance abuse facilities (105 in 2006)
- Geographic concentration: 67% of treatment facilities on Oahu
- Annual patients served: 5,217 total patients
- Service breakdown: 4,511 outpatient patients, 706 residential patients
- Free treatment: 78 facilities offer free treatment
- Specialized services: Only 3 methadone clinics statewide (2023)
Treatment Costs
| Service Type | Individual Cost | State Ranking |
| Residential treatment | $58,810 | 41st (cheapest to most expensive) |
| Outpatient services | $1,536 | 3rd cheapest nationally |
Federal Funding
- Per capita federal grants: Trail national averages by 31%
- Outpatient spending: $6.93 million (0.3% of US total)
- Residential spending: $41.52 million (0.8% of US total)
Hawaii faces a severe treatment capacity crisis, with less than 20% of those needing treatment able to access it. The geographic concentration of services on Oahu leaves rural populations particularly underserved, despite having some of the highest overdose rates.
Demographics and Vulnerable Populations
Treatment Demographics
- Gender distribution: 65.5% male, 34.5% female in treatment (2010)
- Age of first use: 11.8% began before age 12, 53.8% began ages 12-17
- Ethnic composition: 44.6% Native Hawaiian, 15.9% White, 11% Pacific Islander, 8.9% Filipino
Native Hawaiian Disparities
- Youth drug use: 2-3 times higher than some Asian subgroups
- Historical rates: 12.5% past-month illicit drug use (2007) vs 8.1% for white peers
- Treatment admissions: Overrepresented in youth treatment programs
Unhoused Population (Hawaii County Survey)
- Methamphetamine use: 86% lifetime use, 74% current addiction
- Prescription pills: 60% illicit use
- Heroin use: 33% lifetime use
- Opioid addiction: 12% screened positive (6 times US population rate)
- Mental health: 57% clinical depression, 56% anxiety disorder
- Overall health: 86% reported fair/poor health
Gender-Specific Statistics
| Category | Male | Female |
| Overdose deaths (2020) | 188 | 77 |
| Treatment admissions (2010) | 65.5% | 34.5% |
| Women’s prescription misuse (18-49) | N/A | 12.8% |
Significant demographic disparities exist, with Native Hawaiian populations facing disproportionate substance abuse challenges. The unhoused population shows extreme levels of substance use disorders, indicating the intersection of homelessness and addiction requires targeted interventions. This population is also mroe prone to using at-home THC detox tools.
Geographic Variations
Regional Substance Use Patterns
- Hawaii County: Highest community prevalence of substance co-use and poly-use
- Northern Hawaii County: 18.4% co-use cannabis and alcohol
- Statewide cannabis-alcohol co-use: 11.4% of Hawaii Island residents
- Treatment facility distribution: Severe rural-urban divide with 67% of facilities on Oahu
County-Level Treatment Needs
- Rural access: Some rural areas have significantly limited recovery support
- Meth accessibility: Higher in rural Oahu and Maui, impacting Native Hawaiian youth
- Emergency services: Limited specialized drug treatment in outer islands
Geographic disparities create a two-tiered system where urban residents have significantly better access to treatment resources, while rural populations face both higher substance use rates and fewer treatment options.
The data reveals Hawaii faces a complex and intensifying substance abuse crisis characterized by methamphetamine dominance, significant treatment gaps, and stark geographic disparities. While some indicators like prescription opioid deaths show improvement, the overall trajectory indicates a public health emergency requiring comprehensive, culturally appropriate interventions that address both the immediate crisis and underlying social determinants of health.
Statistical Data on Alcohol in Hawaii
Alcohol abuse presents a multifaceted public health challenge in Hawaii, with the state recording 526 annual alcohol-related deaths while maintaining paradoxical patterns that include below-national-average mortality rates yet the nation’s highest excessive drinking rates among seniors at 11%. Hawaiian residents demonstrate complex consumption behaviors, including binge drinking affecting 20.9% of adults with particularly intensive patterns among heavy users who consume a median 9.2 drinks per binge episode, while simultaneously achieving the 7th lowest youth drinking rates nationally. The economic toll reaches $1.265 billion annually when adjusted for inflation, with taxpayers bearing costs equivalent to $2.13 per alcoholic drink consumed, as over 113,000 residents require but cannot access specialty alcohol treatment services. These statistics illuminate a state experiencing a 48% surge in alcohol death rates since 2015 alongside persistent treatment gaps affecting nearly 10% of the population, creating urgent demands for targeted interventions that address Hawaii’s unique demographic vulnerabilities and geographic barriers to care.
Overall Alcohol-Related Deaths and Mortality
Annual Alcohol-Related Deaths
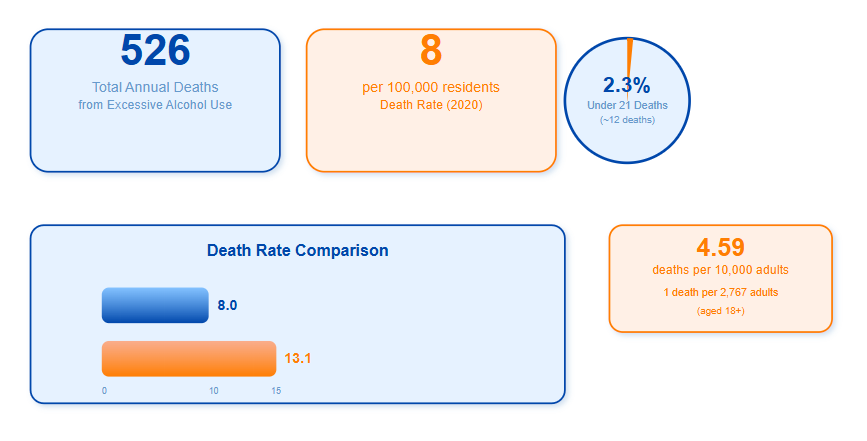
- Total annual deaths: 526 deaths attributable to excessive alcohol use
- Under 21 deaths: 2.3% of all alcohol deaths (approximately 12 deaths)
- Death rate: 8 per 100,000 residents (2020)
- National comparison: Below national average of 13.1 per 100,000 residents
- Adult death rate: 4.59 deaths per 10,000 adults (1 death per 2,767 adults aged 18+)
While Hawaii’s overall alcohol death rate remains below national averages, the state still experiences over 500 preventable deaths annually, indicating significant public health impact despite relatively favorable mortality statistics.
Historical Death Rate Trends
5-year average deaths (2015-2019): 204 deaths per year
- 155 males over 21
- 49 females over 21
- 8 males under 21
- 3 females under 21
The dramatic 48% increase in alcohol death rates over just four years indicates an accelerating crisis, despite maintaining below-average national rates.
Demographics of Alcohol Deaths
| Demographic | Percentage | Analysis |
| Male deaths | 72.6% | Significantly higher than female deaths |
| Chronic causes | 61.2% | Primarily Alcohol Use Disorder |
| Adults 35+ | 87.8% | Overwhelming majority are older adults |
| Under 21 | 2.28% | Relatively low youth mortality |
Specific Cause Breakdown (5-year average 2015-2019)
| Cause of Death | Annual Average |
| Alcohol Dependence Syndrome | 19 deaths |
| Coronary Heart Disease (alcohol-related) | 36 deaths |
| Suicides due to alcohol | 48 deaths |
| Homicides due to alcohol | 16 deaths |
Alcohol-related suicides represent the single largest category of specific alcohol deaths, highlighting the mental health dimensions of alcohol abuse in Hawaii.
Risk Perceptions and Behavioral Patterns
Risk Perception Statistics
- Perceive 5+ drinks as great risk: 506,000 people (43.98% of population 12+)
- Adults perceiving risk: 464,000 people (43.86% of adults)
- Alternative measure: 47.62% perceive drinking 5+ drinks in one session as great risk
Age-Based Risk Perceptions
| Age Group | Great Risk Perception | Behavioral Correlation |
| 12-17 years | 45.18% | Higher awareness, lower use |
| 18-25 years | 40.47% | Lowest risk perception, highest use |
| 26+ years | 44.28% | Moderate perception and use |
Young adults demonstrate the lowest risk perception (40.47%) while simultaneously showing the highest consumption rates, indicating a critical disconnect between awareness and behavior in this demographic.
Geographic and Demographic Variations
Community-Specific Patterns
- Rural communities: Alcohol primary driver in 59.1% of treatment admissions
- Pacific Islander populations: Higher alcohol treatment admission rates in rural areas
- Binge drinking variations: 33.8% binge drinking rate (2017-2019) aligned with national figures
Gender Disparities
- Male alcohol deaths: 72.6% of all excessive alcohol deaths
- Male vs. female risk: Males face significantly higher mortality risk
- Gender-specific treatment needs: Require targeted gender-specific interventions

Significant disparities exist both geographically and demographically, with rural Pacific Islander communities and male populations facing disproportionate alcohol-related harms requiring culturally appropriate and gender-specific interventions.
Historical Trends and Comparative Analysis
Long-term Patterns (2005-2020)
- 2005-2006 baseline: All age groups at or below national rates
- 2015-2019 trend: Up to 48% increase in death rates
- Current status: Below national death rates but concerning local increases
- Youth success: Maintained position among lowest 10 states for youth drinking
National Comparisons
| Metric | Hawaii Rate | National Average | Hawaii Ranking |
| Youth drinking (12-17) | 6.2% | Higher | 7th lowest |
| Excessive drinking | 20.1% | Higher | 44th |
| Death rate | 8 per 100,000 | 13.1 per 100,000 | Below average |
| Senior excessive drinking | 11% | Lower | Highest nationally |
Hawaii presents a paradox – maintaining below-average death rates and youth consumption while experiencing rapid increases in mortality and leading the nation in senior excessive drinking, suggesting evolving patterns requiring adaptive public health responses.
Alcohol Consumption Patterns
Adult Consumption Statistics (2019-2020 Average)
- Past-month alcohol use: 520,000 people (45.10% of population 12+)
- Adult use (18+): 513,000 people (48.46% of adults)
- Binge drinking: 247,000 people (21.46% of population 12+)
- Adult binge drinking: 244,000 people (23.02% of adults 18+)
Age-Specific Consumption Patterns
| Age Group | Past-Month Use | Binge Drinking | Population Impact |
| 12-17 years | 7,000 (7.62%) | 3,000 (3.55%) | Low youth rates |
| 18-25 years | 63,000 (53.41%) | 36,000 (30.47%) | Highest consumption group |
| 26+ years | 450,000 (47.83%) | 208,000 (22.14%) | Largest absolute numbers |
Young adults (18-25) show the highest consumption rates, with over half using alcohol monthly and nearly one-third engaging in binge drinking, indicating this demographic requires targeted intervention.
Detailed Binge Drinking Patterns
- Overall binge drinking rate: 20.9% of adults 18+ binge drink monthly
- Median drinks per binge: 5.7 drinks
- Heavy binge drinkers (top 25%): 9.2 drinks per binge
- Binge frequency: Median 1.9 times per month
- Heavy binge frequency: 4.3 times per month among top 25% of binge drinkers
The data reveals not just widespread binge drinking but intensive patterns among heavy users, with the most active quarter of binge drinkers consuming nearly double the drinks and binging over twice as frequently.
Youth Alcohol Statistics
Underage Drinking (Ages 12-20)
- Past-month alcohol use: 20,000 youth (14.86% of ages 12-20)
- Alternative data: 15.25% of ages 12-20 (slight variation in reporting)
- Binge drinking: 10,000 youth (7.43% of ages 12-20)
- Alternative data: 7.30% binge drinking rate
Youth-Specific Rankings and Comparisons
- Ages 12-17 alcohol use: 6.2% (Hawaii Rank: 7th lowest nationally)
- Historical context: Rates for 12-17 year olds were among 10 lowest in country (2005-2006)
- National comparison: Below national rates for all youth age groups
Hawaii demonstrates relatively successful youth alcohol prevention, ranking among the lowest states for underage drinking, though nearly 15% of 12-20 year olds still report monthly alcohol use.
Senior Citizens and High-Risk Demographics
Senior Alcohol Consumption (2022)
- Excessive drinking among seniors: 11% of older adults
- National ranking: Highest rate of any state
- Public health significance: Represents emerging crisis among elderly population
Hawaii’s distinction as having the nation’s highest rate of excessive drinking among seniors represents a critical and unique public health challenge, potentially linked to social isolation and healthcare access issues.
Alcohol Use Disorders and Treatment Needs
Alcohol Use Disorder Prevalence (2020)
| Age Group | Number with AUD | Percentage | Treatment Gap |
| Total (12+) | 111,000 | 9.69% | High unmet need |
| Ages 12-17 | 2,000 | 2.63% | 1,000 need treatment |
| Ages 18-25 | 17,000 | 14.67% | 17,000 need treatment |
| Ages 26+ | 92,000 | 9.75% | 95,000 need treatment |
| Adults (18+) | 109,000 | 10.31% | 111,000 need treatment |
Treatment Access and Gaps
- Need treatment but not receiving: 113,000 people (9.81% of population 12+)
- Adult treatment gap: 111,000 adults (10.55% of adults)
- Young adult crisis: 14.25% of 18-25 year olds need but don’t receive treatment
The treatment gap is nearly universal – almost everyone with alcohol use disorder needs but doesn’t receive specialty treatment. Young adults face the highest disorder rates (14.67%) and largest treatment gaps.
Historical Treatment Data (2010)
- Alcohol-only treatment: 1,051 people
- Alcohol plus secondary drug treatment: 1,078 people
- Total alcohol-related treatment: 2,129 people
- Rural treatment patterns: 59.1% of rural treatment admissions were alcohol-primary, especially among Pacific Islanders
Historical data shows nearly equal split between alcohol-only and poly-substance treatment needs, indicating complex addiction patterns requiring comprehensive treatment approaches.
Economic Impact and Public Health Costs
Economic Burden
- 2010 economic impact: $937.4 million
- 2022 adjusted value: $1.265 billion
- Cost per drink: $2.13 (2022 US dollars)
- Per capita impact: Significant taxpayer burden

Public Health Metrics
- Years of potential life lost: 12,193 years annually
- Healthcare system impact: Substantial burden on medical facilities
- Crime correlation: 16 annual homicides, 48 annual suicides attributable to alcohol
The economic impact of over $1.25 billion annually represents a massive drain on Hawaii’s resources, equivalent to over $2 per alcoholic drink consumed, highlighting the broader societal costs beyond individual health impacts.
Hawaii’s alcohol landscape reveals a state in transition, maintaining historically favorable mortality statistics while confronting emerging challenges including the nation’s highest senior drinking rates, significant treatment gaps affecting over 113,000 residents, and economic costs exceeding $1.25 billion annually. The dramatic 48% increase in alcohol death rates from 2015-2019, combined with high alcohol use disorder prevalence among young adults (14.67%) and universal treatment access deficits, indicates an escalating public health crisis requiring immediate, comprehensive intervention strategies tailored to Hawaii’s unique demographic and geographic challenges.
Sources:
- Drug Abuse Statistics
- State Epidemiological Profile 2024: Substance Use Trends in Hawaiʻi
- HAWAII DRUG CONTROL UPDATE Drug Use Trends in Hawaii
- HAWAII – National Survey on Drug Use and Health
- 2020 HAWAII DRUG RELATED DEATHS AND OVERDOSE REPORT | End Meth
- Updated Drug and Alcohol Statistics for Hawaii
- Hawaii Drug Statistics, Drug Abuse In Hawaii | Recovery Connection
- Treatment needs of unhoused Hawaiians requires more attention, study says | Inside UCR | UC Riverside
- Addiction Treatment In Hawaii
- Explore Illicit Drug Use – Women in Hawaii | AHR
- How Serious is the Drug Problem in Hawaii?
- How many drug overdose deaths happen every year in Hawaii?
- Explore Excessive Drinking in Hawaii | AHR
- Data Dive: Binge Drinking On The Rise Among Hawaiʻi Seniors – Honolulu Civil Beat
- Alcohol Statistics in Hawaii
- Explore Alcohol Use – Youth in Hawaii | AHR