Statistical Data on Drugs in Alabama
Alabama faces significant challenges with substance abuse and drug-related issues. The state has seen dramatic increases in drug overdose deaths, particularly related to fentanyl and synthetic opioids. While prescription opioid rates have decreased over the years, they remain higher than the national average. The state has also experienced significant increases in methamphetamine-related treatment admissions and faces ongoing challenges with various substance use disorders across different age groups.
Overdose Deaths and Mortality
Current Statistics (2022)
- Total overdose deaths: 1,492
- Death rate: 29 per 100,000 residents
- Comparison: 3% lower than the US national rate
- Trend: 90% increase since 2018
- 2.5x increase since 2013
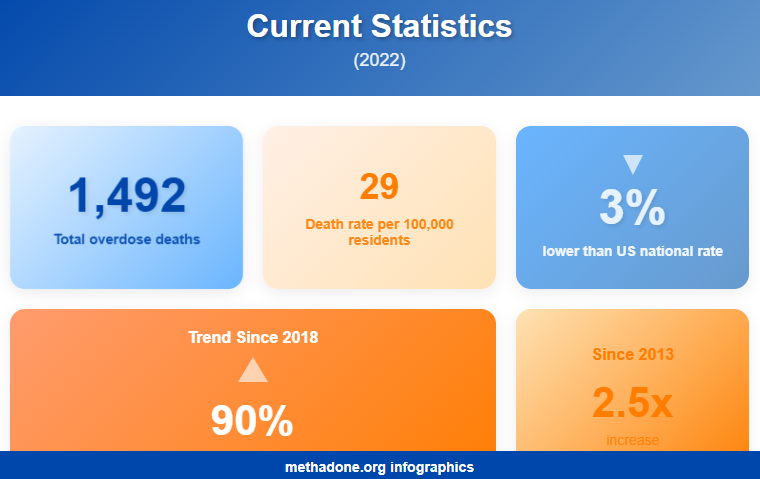
Despite having a death rate slightly below the national average, Alabama has experienced an alarming surge in overdose deaths, with fatalities increasing 90% since 2018.
County-Level Death Rates (2022, per 100,000)
Highest rates:
- Walker: 69.9
- Jefferson: 57.3
- Calhoun: 48.4
- St. Clair: 44.7
- Cullman: 34.2
Lowest rates:
- Lee: 11.6
- Tuscaloosa: 18.6
- Montgomery: 19.0
- Houston: 21.3
- Madison: 27.3
Significant geographic disparities exist, with highest rates being six times greater than lowest rates.
Historical Trends in Drug-Induced Deaths
| Year | Deaths per 100,000 |
| 2012 | 13.1 |
| 2014 | 15.4 |
| 2016 | 16.2 |
| 2017 | 18.0 |
| 2020 | 24.6 |
Drug-induced death rates have nearly doubled over eight years, showing a consistent upward trend.
Substance Use by Age Group (2021-2022)
Youth (Ages 12-17)
- Overall illicit drug use: 5.23%
- Marijuana use (past month): 4.62%
- First-time marijuana use: 4.23%
- Substance use disorder: 7.82%
Young Adults (Ages 18-25)
- Overall illicit drug use: 18.94%
- Marijuana use (past month): 17.61%
- Substance use disorder: 22.27%
- Drug use disorder: 15.23%
Adults (Age 26+)
- Overall illicit drug use: 10.45%
- Marijuana use (past month): 7.76%
- Substance use disorder: 14.07%
Young adults (18-25) show significantly higher rates of substance use across all categories compared to other age groups, indicating a particular vulnerability in this population. The use of various weed detox kits is also commonplace among this age group.
School-Related Statistics
Drug activity:
- Buying/selling at school: 10%
- Buying/selling outside school: 17.8%
Teacher engagement:
- 44.3% seldom/never discuss drug problems
- 33.6% limited drug education engagement
High levels of student drug activity coupled with insufficient educational intervention indicate a concerning school environment. Additionally, many teenagers belive that they can easily get rid of marijuana dependence merely by engaging in THC detox at home.
Substance Use Disorder Statistics (2021-2022)
| Disorder Type | Total Population | Youth (12-17) | Young Adults (18-25) | Adults (26+) |
| Substance Use Disorder | 14.51% | 7.82% | 22.27% | 14.07% |
| Drug Use Disorder | 8.74% | 6.32% | 15.23% | 8.00% |
| Pain Reliever Use Disorder | 2.65% | 1.11% | 1.46% | 3.02% |
| Opioid Use Disorder | 3.03% | 1.12% | 1.55% | 3.49% |
Young adults show the highest rates of general substance use disorders, while older adults have higher rates of opioid and pain reliever disorders, suggesting age-specific patterns of substance abuse that require targeted intervention strategies.
Marijuana Use Trends
Marijuana Use by Age Group Over Time (2015-2021)
| Age Group | 2015-2016 | 2016-2017 | 2017-2018 | 2018-2019 | 2021 |
| Ages 12-17 | 5.2% | 5.3% | 6.2% | 5.8% | 4.0% |
| Ages 18-25 | 14.3% | 16.5% | 18.7% | 18.3% | 17.7% |
| Ages 26+ | 3.8% | 4.9% | 6.9% | 7.5% | 6.3% |
Marijuana use shows a recent declining trend across all age groups, with the most significant decrease among adolescents, suggesting potentially successful prevention efforts among younger populations. However, it should be noted that adults and young adults may use detox shampoos to cheat hair drug tests.
Opioid Crisis Impact
Recent Trends
Prescription opioid dispensing rates:
- 2012: 143.8 per 100 residents
- 2018: 92.8 per 100 residents
- 2022: 80.4 per 100 residents
While prescription opioid rates have decreased significantly (44% drop from 2012 to 2022), the rise in fentanyl deaths indicates a dangerous shift toward more lethal synthetic opioids.
Prescription Drug Misuse
Pain Reliever Misuse (2021-2022)
| Age Group | Number (thousands) | Percentage |
| 12-17 | 8 | 1.95% |
| 18-25 | 18 | 3.50% |
| 26+ | 154 | 4.60% |
Pain reliever misuse increases with age, with adults 26+ showing the highest rates.
Specific Drug Use Statistics
Cocaine Use and Treatment
Gender distribution (2020):
- Male: 59.7%
- Female: 40.3%
Methamphetamine Impact
Treatment admissions (2020):
- Total: 2,923
- Male: 54.2%
- Female: 45.8%
Heroin Statistics
Treatment admissions (2020):
- Total: 2,354
- Male: 53.6%
- Female: 46.1%
Treatment data shows a trend toward gender parity in treatment admissions for most substances, though males still represent a slight majority across all categories.
Risk Perception Rates
- Cocaine use (monthly): 72.11% perceive great risk
- Heroin use (trying once/twice): 83.70% perceive great risk
- Marijuana use (monthly): 24.96% perceive great risk
Risk perception varies significantly by substance, with traditional illicit drugs perceived as most dangerous and marijuana as least risky.
Treatment and Facilities
Treatment Centers (2023)
- Active substance abuse centers: 171
- Annual patient service: 14,578
- Outpatient services: 13,567 patients annually
- Residential services: 797 patients annually
- Hospital-based treatment: 214 clients
- Free treatment facilities: 4
Treatment Costs
- Average outpatient cost per individual: $1,703
- Average residential treatment cost: $58,607
- State ranking for residential treatment cost: 38th (from cheapest to most expensive)
There is a significant cost disparity between outpatient and residential treatment, which may create barriers to access for many residents.
Substance-Specific Treatment Admissions
| Substance | Number of Admissions (2018) |
| Heroin | 4,546 |
| Other opiates/synthetics | 7,082 |
| Marijuana | 2,980 |
| Amphetamines | 2,923 |
| Cocaine (smoked) | 462 |
| Cocaine (other routes) | 288 |
Opiates and synthetics represent the largest category of treatment admissions, indicating the continuing impact of the opioid crisis in Alabama.
Treatment Program Specifics (2011)
Medication-Assisted Treatment Trends
Methadone treatment:
- 2015: 7,639 people
- 2019: 7,093 people (7.1% decrease)
Buprenorphine treatment:
- 2015: 787 people
- 2019: 1,274 people (61.9% increase)
While methadone remained the dominant treatment with over 7,000 patients in 2019 despite a slight decline, buprenorphine treatment saw a significant 61.9% increase, indicating a gradual shift in treatment approaches.
Prevention and Treatment Access
- 71.05% of those needing treatment don’t receive it
- 63.6% receive treatment for drug problems only
- 26.7% receive treatment for both drug and alcohol problems
Treatment Needs vs. Access (2022)
| Age Group | Needing Treatment | Received Treatment | Treatment Gap |
| Total (12+) | 17.85% | 5.23% | 71.05% |
| Youth (12-17) | 11.85% | 5.97% | 56.41% |
| Young Adults (18-25) | 24.56% | 4.99% | 80.84% |
| Adults (26+) | 17.46% | 5.18% | 70.12% |
The substantial treatment gap across all age groups, particularly among young adults, indicates a critical need for expanded treatment access and reduced barriers to care.
Treatment Facility Distribution (2017)
- ADMH certified entities: 83
- Non-funded providers: 11
- Opioid Treatment clinics: 21
- Regional mental health boards: 19
- Providing substance treatment: 14
Treatment infrastructure shows notable gaps, with limited free treatment options and regional coverage.
Rural vs Urban Disparities
Treatment Access
Rural areas:
- 22% higher overdose death rates
- 41% fewer treatment facilities
Urban areas:
Free treatment facilities statewide: 4
Analysis: Geographic and demographic disparities significantly impact both access to treatment and overdose mortality rates.
Gender Distribution in Treatment (2020)
| Substance | Male | Female |
| Cocaine | 59.7% | 40.3% |
| Heroin | 53.6% | 46.1% |
| Marijuana | 62.9% | 37.1% |
| Amphetamines | 54.2% | 45.8% |
Women’s Drug Use Statistics
Women ages 18-49:
7.8% reported misusing prescription drugs or using illicit drugs
Women show increasing representation in treatment admissions across most substance categories, suggesting a need for gender-specific treatment approaches.
Healthcare Impact
Emergency Services (2022)
- Emergency calls for possible overdoses: 4,669 (first half of 2022)
- Emergency department visits related to overdose (2018): 11,081
- Opioid-related emergency visits: 2,180
- Overdose-related 911 runs: 20,353
The high number of emergency services calls and visits demonstrates the significant burden that substance use places on Alabama’s healthcare system. It’s also worth noting that many marijuana users use at-home THC detox kits.
Substance Use Impact on Neonatal and Maternal Health
Neonatal Abstinence Syndrome (NAS):
- National trend: 5x increase (2004-2014)
- Rate increase: 1.5 to 8.0 cases per 1,000 hospital births
- Frequency: One baby born with NAS every 15 minutes
- Hospital costs: Increased from $91 million to $563 million
The dramatic increase in NAS cases and associated costs highlights the generational impact of substance use disorders and the growing strain on healthcare resources.
HIV and Hepatitis Statistics (2015-2016)
HIV cases:
- New cases (2016): 533
- Living with HIV: 12,316 (302 per 100,000)
- Male IDU-related: 12.6%
- Female IDU-related: 15%

Hepatitis C:
- New acute cases (2016): 32 (0.7 per 100,000)
- Living with HCV: 31,300 (840 per 100,000)
Injection drug use significantly impacts disease transmission, particularly affecting females at higher rates.
Correctional System Impact
Prison Treatment Programs (2014)
In aftercare programs: 2,059 inmates
Specialty courts:
- Adult drug courts: 41
- Domestic violence courts: 3
- Juvenile drug courts: 6
Significant integration of drug treatment within the correctional system indicates recognition of substance abuse as a criminal justice issue.
The drug situation in Alabama presents significant challenges, with a dramatic 90% increase in overdose deaths since 2018 and a concerning 590% rise in fentanyl-related fatalities between 2018 and 2022. A substantial treatment gap exists, with 71% of those needing treatment unable to access it, particularly impacted by geographic disparities where rural areas have 41% fewer facilities despite higher overdose rates. Young adults (18-25) represent the most vulnerable population with the highest substance use rates (22.27%), while limited access to free treatment facilities (only 4 statewide) and high residential treatment costs ($58,607 per individual) create significant barriers to recovery.
Statistical Data on Alcohol in Alabama
Alabama faces significant challenges with alcohol use, though it ranks 48th out of 50 states in overall alcohol consumption. The state shows concerning trends in youth drinking and alcohol-related fatalities, with particularly high rates of under-21 alcohol-related deaths. Despite lower overall consumption compared to national averages, the economic and social impacts remain substantial.
General Statistics
- Annual alcohol-related deaths: 2,208
- Total economic cost (2022): $5.028 billion ($3.06 per drink)
- Years of potential life lost annually: 59,606
Despite lower overall consumption rates, Alabama faces significant public health and economic impacts from alcohol use.
Alcohol-Related Deaths
- 71.5% are male
- 79.9% are aged 35 and older
- 49.8% from chronic causes (e.g., Alcohol Use Disorder)
- 3.94% under age 21
Alcohol-related deaths in Alabama predominantly affect males and older adults, with chronic conditions accounting for half of all fatalities.
Alcohol Use by Age Group (2021-2022)
| Age Group | Past Month Use | Binge Drinking | Alcohol Use Disorder |
| 12-17 | 5.72% | 3.10% | 3.13% |
| 18-25 | 40.59% | 24.40% | 14.20% |
| 26+ | 43.70% | 19.70% | 8.83% |
Young adults (18-25) show particularly high rates of problematic alcohol use, with significantly higher binge drinking and disorder rates than other age groups.
Youth Alcohol Consumption (Ages 12-20)
- Past month alcohol use: 86,000 users (13.81%)
- Binge drinking: 48,000 users (7.65%)
- Risk perception of binge drinking: 39.75%
Underage drinking remains a significant concern, with a notable gap between risk perception and behavior.
Location of Youth Alcohol Use
- Home or friend’s home: 56.5% of 12th graders
- Access perception: 63.6% report alcohol is easy to obtain
Most youth alcohol consumption occurs in private residences, facilitated by perceived easy access.
Youth Alcohol Behavior (12th Grade Students)
- Average age of first use: 11.3 years
- Monthly alcohol use: 40%
- Binge drinking: 37.7%
- Driven after drinking (past 30 days): 20.5%
- Rode with drinking driver: 30.2%
- Access perception: 63.6% say alcohol is fairly/very easy to get
- Peer attitudes: 75.3% say friends believe alcohol use is only a little wrong or not wrong at all
Youth statistics show concerning early initiation and high-risk behaviors, compounded by permissive peer attitudes and easy access.
Regional Comparisons (2017-2019)
| Measure | Alabama | Regional Avg | National Avg |
| Youth Alcohol Use | 8.4% | 9.2% | 9.4% |
| Young Adult Binge | 26.3% | 30.1% | 35.4% |
| Adult Disorder | 5.3% | 4.5% | 5.3% |
Alabama generally shows lower rates of alcohol use compared to both regional and national averages, but matches national rates for alcohol use disorder.
Geographic Distribution
County-Level Excessive Drinking
- Baldwin County: 19% (highest in state)
- Cherokee County: 18%
- Several counties: 17%
- State average: 16% (below U.S. average of 19%)
Even the highest-drinking counties in Alabama remain below the national average of 19%.
Historical Trends
Alcohol Use Patterns (2016-2021)
| Age Group | 2016-2017 | 2017-2018 | 2018-2019 | 2021 |
| Ages 12-17 | 4.4% | 4.8% | 4.3% | 3.4% |
| Ages 18-25 | 31.5% | 29.6% | 28.0% | 23.4% |
| Ages 26+ | 21.8% | 24.0% | 25.4% | 20.0% |
All age groups show a declining trend in drinking by 2021, possibly influenced by changing social patterns.
Binge Drinking Patterns
Median drinks per binge: 5.5
Top 25% most active drinkers:
- Drinks per binge: 7.2
- Frequency: 4.0 times monthly
Regular binger frequency: 1.7 times monthly
While overall drinking rates are lower than national averages, heavy drinkers show concerning patterns of consumption.
Risk Perception and Behavior
Population Numbers (thousands)
| Category | Total Population | With Great Risk Perception |
| Ages 12+ | 1,696 | 1,837 |
| Ages 12-17 | 23 | 157 |
| Ages 18-25 | 214 | 205 |
| Ages 26+ | 1,460 | 1,474 |
Risk perception of heavy drinking is relatively high across all age groups.
Traffic Safety Impact (2012)
Total DUI-involved crashes: 10,083
- Male drivers: 6,630
- Female drivers: 2,911
- Unspecified gender: 542
Fatality rate in DUI crashes: 2.86% (4 times higher than general crash rate of 0.68%)
DUI crashes show significant gender disparity and dramatically higher fatality rates compared to non-DUI crashes.
Alcohol-Impaired Driving (2020)
| Time Period | Fatal Crashes | % Alcohol-Impaired |
| Midnight – 2:59 AM | 75 | 50% |
| 9:00 – 11:59 PM | 72 | 38% |
| 6:00 – 8:59 PM | 76 | 32% |
| 6:00 – 8:59 AM | 37 | 9% |
Night-time hours show significantly higher rates of alcohol-impaired fatal crashes, with midnight to 3 AM being the most dangerous period.
Treatment Demographics
- Primary alcohol abuse admissions: 4,635
- Combined alcohol/drug abuse: 2,746
- Gender distribution in treatment: 62% male (compared to 54% nationally)
- College students: Binge drinking 22% higher than regional average
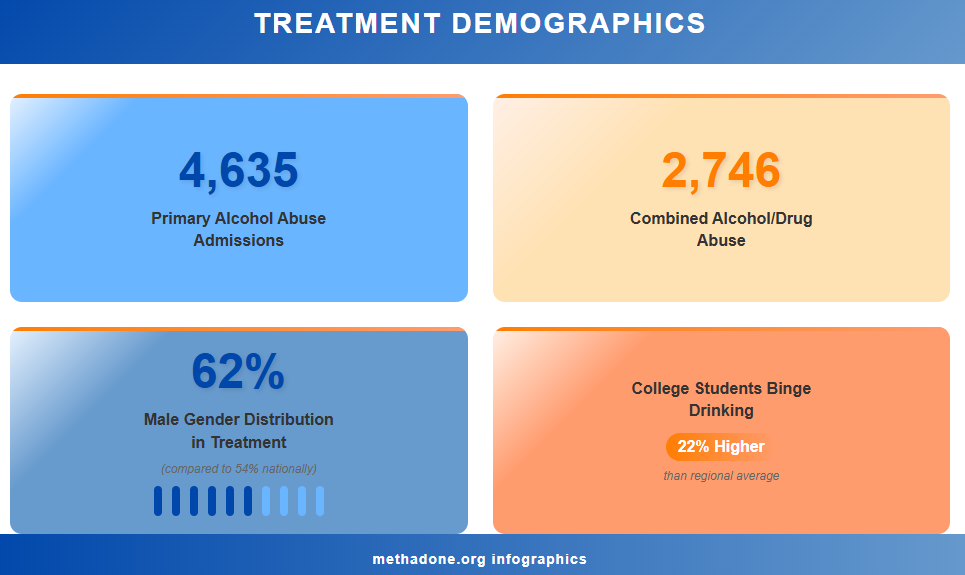
Treatment data show significant gender disparity and particularly high rates among college students compared to regional averages.
Despite ranking 48th in overall alcohol consumption nationally, Alabama faces significant challenges with alcohol use, particularly among specific demographics. The state’s annual cost of $5.028 billion and 2,208 alcohol-related deaths highlight substantial public health impacts. Young adults (18-25) show the highest risk, with concerning rates of binge drinking and alcohol use disorder, while underage drinking remains problematic with an average initiation age of 11.3 years. Although overall consumption rates are below national averages, the state faces particular challenges with alcohol-impaired driving fatalities, gender disparities in treatment, and high-risk drinking patterns among heavy users.
In general, Alabama faces dual challenges with substance abuse despite ranking low (48th) in overall alcohol consumption. Drug overdose deaths have increased 90% since 2018, with fentanyl deaths rising 590%, while alcohol causes 2,208 deaths annually and costs $5.028 billion. Young adults (18-25) show the highest risk for both substances, with 22.27% experiencing substance use disorder and 24.40% engaging in binge drinking. Critical gaps in treatment access persist, with 71% of those needing drug treatment unable to receive it, and significant disparities exist between rural and urban areas, where rural regions have 41% fewer facilities despite higher overdose rates.
Sources:
- Drug Abuse Statistics
- Alabama Opioid Epidemic & Addiction Statistics | Birmingham Recovery
- Alabama Epidemiological Profile: Alcohol, Tobacco, Other Drugs Use and Misuse 2022
- ALABAMA – National Survey on Drug Use and Health: 2021-2022
- Explore Illicit Drug Use – Women (18-49) in Alabama | AHR
- How many drug overdose deaths happen every year in Alabama?
- The Latest Drug Addiction Statistics in Alabama
- Behavioral Health Barometer Alabama, Volume 6
- Alabama Opioid Summary
- Tuscaloosa Teenage Substance Abuse Statistics
- Alabama Substance Abuse Statistics | Recovery Connection
- Drug Abuse Statistics in Alabama
- Ala. Admin. Code r. 410-2-2-.07 – Substance Use Disorder | State Regulations | US Law | LII / Legal Information Institute
- Map: These Alabama counties are home to the most excessive drinkers, study finds